




Operations
Fleet Personal-Use Charges Edge Higher in 2026
Nearly eight in 10 surveyed fleets allow personal use of company vehicles, while just over half of respondents report charging employees for the privilege.
 MENU
MENU SEARCH
Vincentric’s three-year, 60,000-mile projections reveal wide differences for both scheduled and unscheduled maintenance among selected vehicle categories. Projected maintenance visits also play a factor.
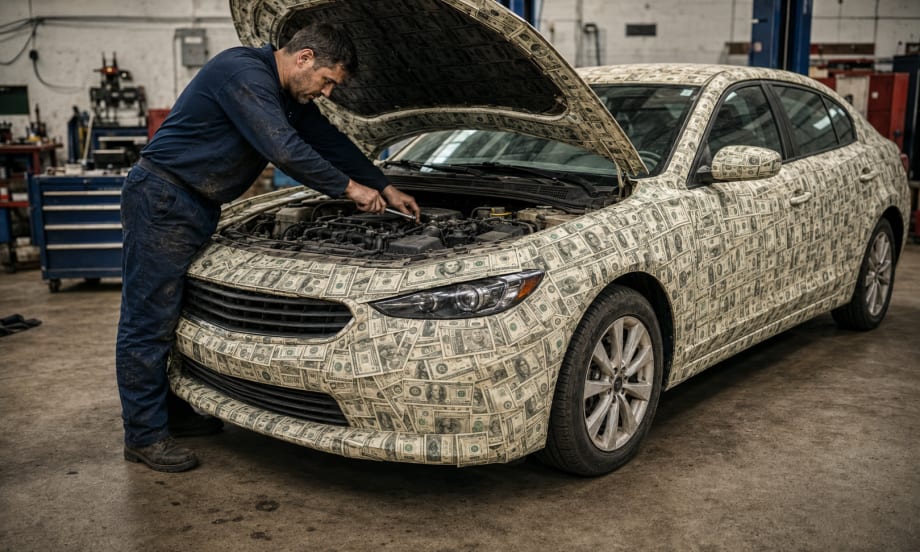
When maintenance costs climb, fleet vehicles can start to look like they’re made of money. Bringing maintenance projections into the spec’ing process can help fleets understand where those dollars are likely to go.
This image generated using ChatGPT. Refer to our Terms of Service.
Maintenance has become a major pressure point in fleet budgets. The cost of vehicle maintenance and repairs increased 41% between 2020 and 2025, according to federal inflation data, and prices continued rising into 2026. Parts cost more, shop labor rates have climbed, and technician availability has tightened, particularly for diesels.
TechForce Foundation estimates that the number of students completing automotive technician programs is 29% short of annual industry demand, while the gap is 52% for diesel technicians.
Fleets can’t control the technician shortage, but they can better understand how vehicle selection affects the amount and type of maintenance they are likely to buy. Maintenance is never the first consideration when spec’ing, but taking it into account matters as costs climb, particularly when multiplied across hundreds of units.
To examine how those costs vary, Automotive Fleet worked with the lifecycle cost experts at Vincentric to compare projected maintenance expenses for 27 model-year 2026 configurations. The analysis covers five fleet segments over three years or 60,000 miles and separates manufacturer-scheduled services from expected wear items such as tires, brakes, wiper blades, and bulbs, which Vincentric classifies as unscheduled maintenance.
Vincentric treats repairs (unexpected services) as a separate cost category. Repairs and warranty work are not included in this data.
The results should not be interpreted as comprehensive segment rankings or purchasing recommendations. The point is not to identify the models with the lowest maintenance costs; it is to show what fleets may miss when maintenance data is not part of the spec’ing process.
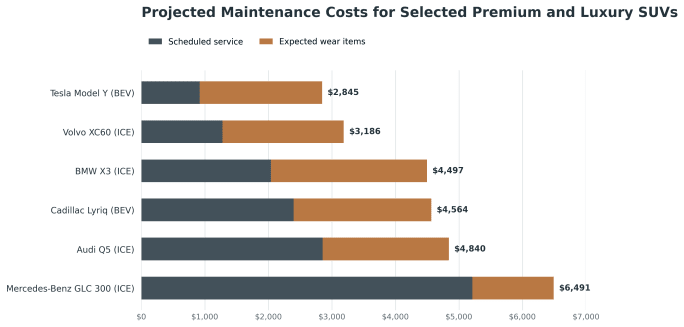
Vincentric’s three-year/60,000-mile projections reveal significant maintenance-cost differences in this category, with the Tesla Model Y posting the lowest projected total and the Mercedes-Benz GLC 300 the highest.
Vincentric
Even within these limited comparison sets, the projected maintenance cost differences were substantial. The gap between the lowest- and highest-cost examples ranged from $1,686 among the selected half-ton pickups to $3,646 among premium and luxury SUVs.
Among the selected cargo vans, the range was $2,842 per vehicle. It reached $2,672 among compact SUVs and $3,499 among passenger cars.
Those figures do not establish which vehicle a fleet should buy. But projected maintenance differences that appear relatively modest on a per-unit basis can become material at scale.
The composition of those costs matters as well. A vehicle may have relatively low manufacturer-scheduled service costs but higher expected spending on tires, brakes and other wear items.
Another may require more frequent or more expensive scheduled service. Looking beneath the total helps fleets understand not only how much they may spend, but where that expense is expected to originate.
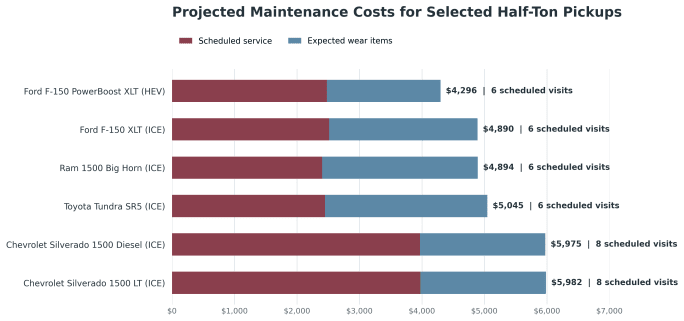
Vincentric’s projected maintenance costs cover three years/60,000 miles and include manufacturer-scheduled service and expected wear items. Scheduled visits are shown because even small differences in service frequency can multiply into hundreds or thousands of additional shop events across a large pickup fleet.
Vincentric
Hybrids are already strong TCO performers because they combine reduced fuel consumption with comparatively favorable depreciation and resale values. The Vincentric data also shows that selected hybrids are competitive on maintenance.
The Ford F-150 PowerBoost has the lowest projected maintenance cost among the six selected half-ton pickups at $4,296 over three years/60,000 miles. That is $594 less than the conventional F-150 configuration in the comparison and nearly $1,700 below the selected Chevrolet Silverado gasoline and diesel models.
The Toyota RAV4 Hybrid’s $4,510 projection is the second lowest among the five selected compact SUVs. The Toyota Camry Hybrid’s projected $4,515 total is below those of the selected Hyundai Sonata and Nissan Altima.
However, fleets planning to operate vehicles beyond the three-year/60,000-mile window should extend the analysis, because hybrid-specific maintenance requirements may become more significant at higher mileages.
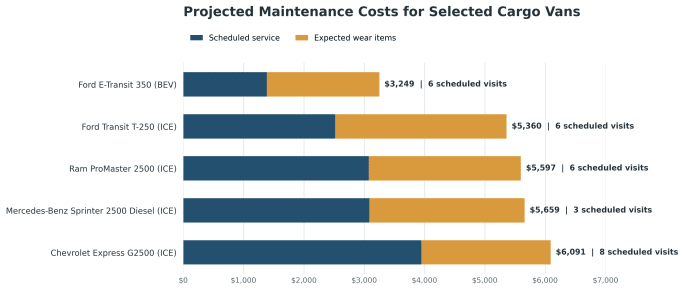
Vincentric’s projected maintenance costs cover three years/60,000 miles and include manufacturer-scheduled service and expected wear items. Scheduled visits are included because service frequency can create downtime and operational costs that are not reflected in the maintenance total alone.
Vincentric
The selected battery-electric vehicles generally perform well. The Tesla Model 3 and Model Y have the lowest projected maintenance costs in their respective comparison groups, while the Ford E-Transit posts the lowest total among the selected cargo vans.
Electrification does not guarantee the lowest maintenance cost. The Cadillac Lyriq’s projected $4,564 total exceeds the gasoline-powered Volvo XC60’s $3,186 and BMW X3’s $4,497. The $1,719 difference between the Lyriq and Tesla Model Y also demonstrates that two BEVs in the same category can carry different costs.
The compact SUVs reinforce the point. The gasoline-powered Volkswagen Tiguan has the lowest projection in that selected group at $3,728, ahead of the RAV4 Hybrid at $4,510 and three other gasoline-powered models.
A vehicle’s service schedule, expected wear costs and manufacturer-provided maintenance program can influence the result alongside its powertrain. Several vehicles in the analysis include factory-paid scheduled maintenance for a portion of the three-year cycle. Fleets should understand what those programs cover, how long the coverage lasts, and whether service locations align with their operating footprint.
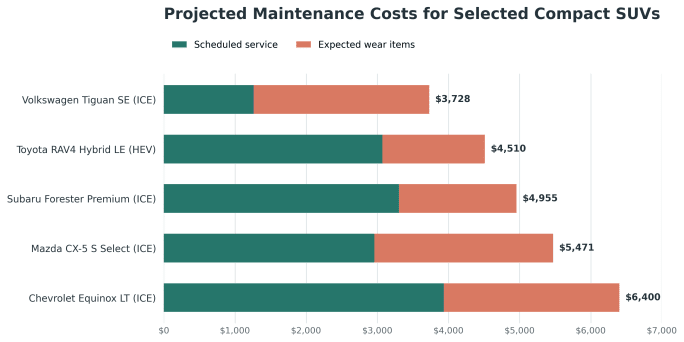
Vincentric’s three-year/60,000-mile projections show how manufacturer-scheduled service and expected wear-item costs vary among selected compact SUVs. The gas-powered VW Tiguan has the lowest projected total in this comparison, followed by the Toyota RAV4 Hybrid.
Vincentric
For revenue-generating vans and trucks, the maintenance invoice may not be the largest consequence. What’s more important are canceled appointments, delayed projects, overtime, rental expense, and dissatisfied customers.
That makes scheduled service frequency another specification to examine. Vincentric projects only three scheduled maintenance visits for the Mercedes-Benz Sprinter over three years/60,000 miles, compared with six for the E-Transit, Ford Transit and Ram ProMaster and eight for the Chevrolet Express.
The Sprinter does not have the lowest projected maintenance cost, but its 20,000-mile service interval could provide operational value for fleets that place a premium on keeping vans in service.
The selected pickups offer another example. The F-150, F-150 PowerBoost, Ram 1500 and Toyota Tundra each have six projected scheduled visits. The two Silverados have eight. Two additional visits may appear inconsequential for one truck, but across 500 units, they create 1,000 additional service events during the replacement cycle.
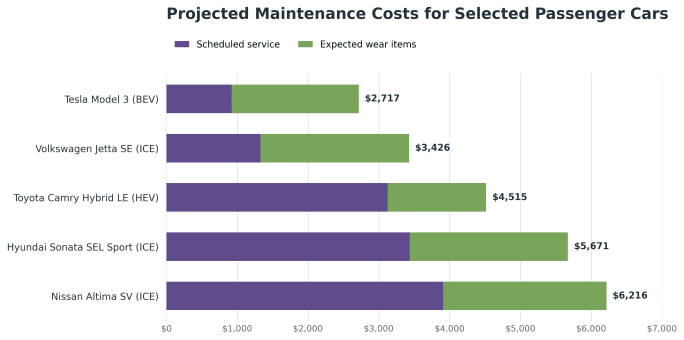
Over three years/60,000 miles, Vincentric projects the Tesla Model 3 will have the lowest maintenance cost among these selected passenger cars.
Vincentric
None of these projections should determine vehicle selection on its own. The lowest-maintenance vehicle may not have the payload, range, equipment, safety features or operating characteristics the fleet requires. A slightly higher-cost vehicle may also deliver greater uptime, stronger resale value or better overall TCO.
The analysis instead demonstrates why maintenance should have a defined place in the spec’ing process. Fleets should seek projections that match their intended replacement cycle, examine scheduled service and expected wear items separately, review factory-paid coverage and consider the operational effect of service frequency.
Loading data...

Operations
Nearly eight in 10 surveyed fleets allow personal use of company vehicles, while just over half of respondents report charging employees for the privilege.












Safety
Insights from a commercial insurance carrier and a broker show how fleets can turn video telematic data, driver coaching, and improved claims results into a stronger case at insurance renewal.
Fleet Forward
Five fleet professionals — none with programming skills — discuss how they’re using AI to build fleet solutions in-house and in a fraction of the time.
Maintenance
Vincentric’s three-year, 60,000-mile projections reveal wide differences for both scheduled and unscheduled maintenance among selected vehicle categories. Projected maintenance visits also play a factor.
State of the Fleet Industry
Most organizations misunderstand fleet. The best managers make sure that doesn’t happen.
Remarketing
A vehicle health score could improve the value of fleet vehicles at remarketing. The path to a universal standard is forming, and fleets that understand the process early will be better positioned when it arrives.
Technology
AI is no longer a luxury but the baseline for profitability in 2026. Auto haulers that adopt these tools now will quickly outpace those that use manual workflows or take a wait-and-see approach.
Fleet Forward
The job hasn’t changed, but the expectations have. Do you have a plan on how to use AI to thrive?
Maintenance
The repair crisis gets blamed on technician shortages and parts delays. But a big part of the problem is what's happening before the vehicle even reaches the shop, and that's within your control.
Remarketing
Smart remarketing begins before vehicles enter the fleet, and is built on strong data and stronger FMC partnerships.
State of the Fleet Industry
When the US’s largest EV manufacturer discontinues a model, it gives me pause to consider the software that drives it.
Operations
Here’s what is keeping fleet managers up at night this year, and what they're doing about it.
Leasing
As costs rise and scrutiny increases, fleets are refining criteria that govern eligibility for company-owned vehicles.