





Use this vehicle research tool to compare lifecycle costs and fleet incentives by model & class.
Carbon Emissions Vs. Ownership Costs: Cargo Vans
When comparing a vehicle’s carbon emissions and its total cost of ownership, which vehicles and powertrain types in the cargo van segment offer the maximum benefit for the money? [Part 3 of 5]
March 19, 2025
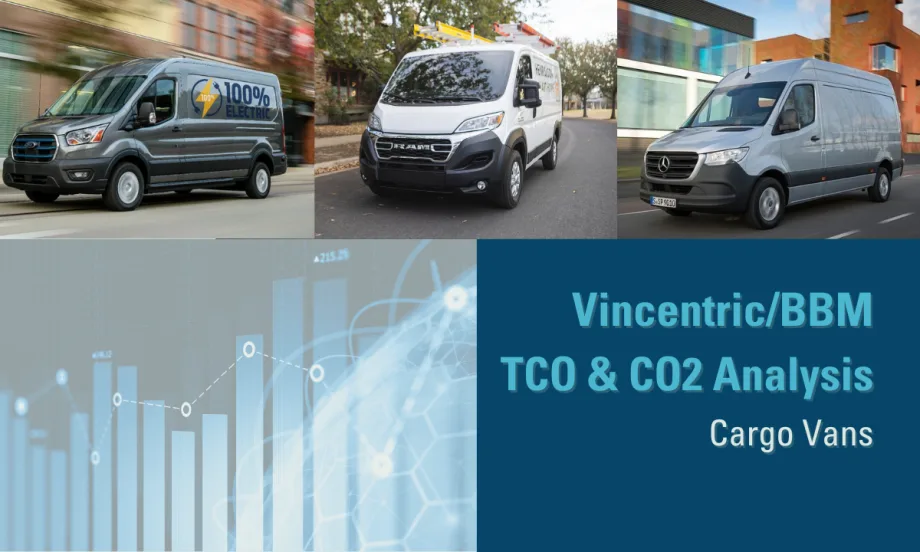
Though the comparative set is limited, electric cargo vans deliver an attractive TCO and a strong emissions benefit compared to ICE counterparts.
Photo: BBM
4 min to read
For most corporate fleet managers, balancing sustainability initiatives while keeping fleet costs in check is a top priority. Yet sourcing vehicles’ carbon emissions, matching them to vehicle routes, defining ownership costs, and then performing the cost-benefit analysis is a time and resource-consuming endeavor.
This study may help overcome these initial hurdles. We asked the lifecycle cost experts at Vincentric to provide total cost of ownership (TCO) data for 2024 model-year vehicles driven 20,000 miles per year for five years in these categories: half-ton pickups, cargo vans, passenger cars, compact SUVs, and luxury vehicles.
The resulting list produced close to 1,300 total vehicle configurations with gas and diesel (ICE), battery electric (BEV), hybrid electric (HEV), and plug-in hybrid electric (PHEV) powertrains.
As usual, Vincentric calculated its standard eight cost elements: depreciation, financing, fees and taxes, fuel, insurance, maintenance, opportunity cost, and repairs. This time, Vincentric also provided annual in-use carbon (CO2) emissions for each vehicle.
We divided the analysis by segment. We’ve already published results for compact SUVs and pickups. We now turn to cargo vans. But first:
How Emissions Are Calculated
Vincentric broke out four sets of CO2 emissions by metric tons per year:
Electric generated (BEVs and PHEVs): Defined by the amount of CO2 emissions produced by power plants needed to power these vehicles.
Tank-to-wheel (ICE & HEV): Defined by the amount of CO2 emissions produced from burning fuel within a vehicle while the vehicle is in motion.
Well-to-tank (ICE & HEV): CO2 emissions produced from extracting, refining, and delivering fuel to the vehicle.
Annual in-use CO2 emissions: Totals the above three values for all vehicles in a single value demonstrating the yearly release of CO2 and Nitrous Oxide.
With this data, Automotive Fleet calculated the average annual in-use CO2 emissions and TCO for every vehicle configuration, sorted by vehicle segment. We then calculated the average percentage improvement in CO2 emissions when switching from an ICE engine to a BEV, HEV, BEV, or PHEV. (Note: for BEVs, the analysis does not include charging infrastructure costs.)
AF also included the top 5 TCO performers in each segment.
On to the analysis:
Cargo Vans
Like pickups, the available configurations of a single cargo van model are numerous, though only one electric version, Ford E-Transit, is available in the Vincentric data.
(Other Class 2b electric cargo vans include the Ram Promaster EV, Rivian’s delivery vans, and Brightdrop Zevo 400.)
ICE: 154 configurations
5-Yr TCO average: $94,426
Average yearly CO2 output (metric tons): 13.00
Out of those 154 ICE configurations, Mercedes-Benz offers 41 diesel Sprinter versions. The Sprinter diesels take three of the top five on the TCO list and six of the top 10. The other four are gas GMC Savana configurations.
With better energy efficiency than gas, diesel models show as much as a 42% drop in CO2 compared to their gas counterparts. However, diesels also emit greater amounts of nitrogen oxides (NOx), particulate matter (PM), and sulfur oxides (SOx).
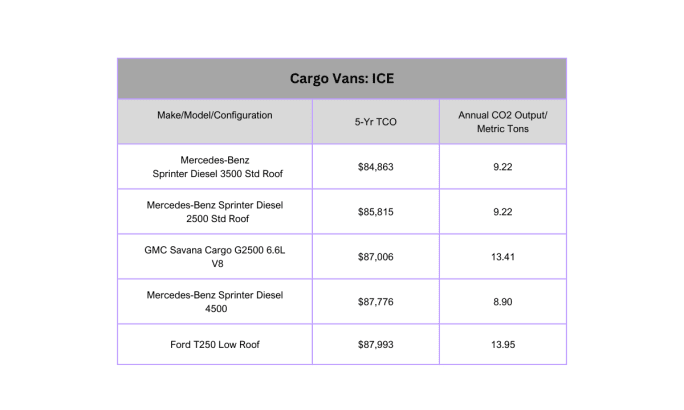
The Sprinter diesels take three of the top five on the TCO list and six of the top 10.
Source: BBM
BEV: 5 configurations (single model)
5-Yr TCO average: $87,078
Average premium BEV over ICE: -$7,218
Average yearly CO2 output (metric tons): 4.42
Average yearly CO2 savings by switching from ICE to HEV: 66%
The cargo van segment offers a compelling case to switch to electric, as last-mile delivery and other local fleet applications run high miles that don’t exceed an electric cargo van’s maximum range.
In this segment with only one EV model, the caveat is limited comparisons. The average $7,218 TCO savings compared to ICE is a misnomer, as the comparative set has many more expensive van models with greater capabilities.
However, an apples-to-apples comparison of E-Transit models to gas-powered Transits reveals about equal TCO for both. At the same time, the annual CO2 output for the E-Transit is about 70% less than the gas versions — the biggest savings of any like-model comparison in this analysis.
It should be noted that E-Transit offers slightly less payload capacity than its ICE counterparts; therefore, configuration and duty cycles matter. Similar to pickups, load and range needs are a key factor in the ability to switch.
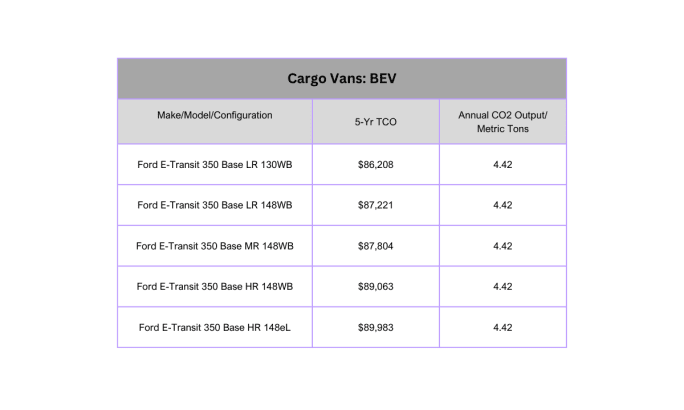
The average $7,218 TCO savings compared to ICE is a misnomer, as the comparative set has many more expensive van models with greater capabilities.
Source: BBM
Notes & Cautions
This analysis is meant to be directional only. It does not account for nuances in the capacities and capabilities of individual models within a segment.
The overall list includes manufacturers that don’t have a formal fleet program. They were included in the averages but not in our top 5 lists.
Often, one model dominates the top 5 TCO list. We point these cases out in the text. For the list, we include the top model’s best TCO configuration and move on to the next best-performing model.
Subscribe to Our Newsletter
More Vehicle Research
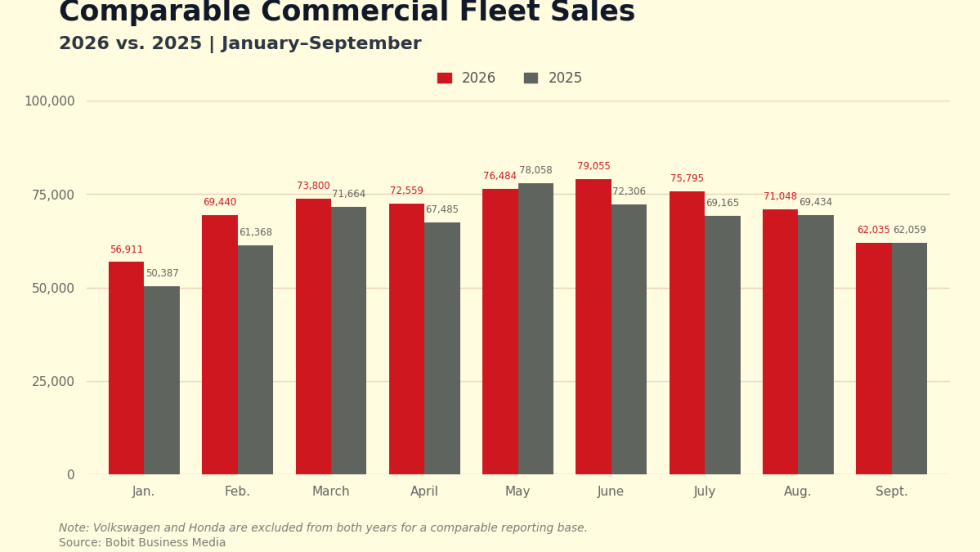
Commercial Fleet Sales Rise 5.8% Through September 2026
September commercial fleet sales were essentially unchanged from a year earlier, slowing year-to-date growth while keeping volume ahead of 2025.
Read More →
Hall of Fame Inductee: John Dmochowsky
The longtime Mondelēz International fleet executive joins the Automotive Fleet Hall of Fame.
Read More →
Hall of Fame Inductee: Lee Miller
After more than four decades at Boehringer Ingelheim, Lee Miller leaves a legacy built on fleet expertise.
Read More →
Hall of Fame Inductee: Mark F. Petersen
From managing fleets of thousands of vehicles to advancing safety and mentoring fellow professionals, Mark F. Petersen made his mark across both the corporate and supplier sides of fleet.
Read More →
When Charger Downtime Becomes a Fleet Availability Problem
As EV deployments move beyond pilot programs, charger reliability can directly affect vehicle readiness, driver productivity and route scheduling.
Read More →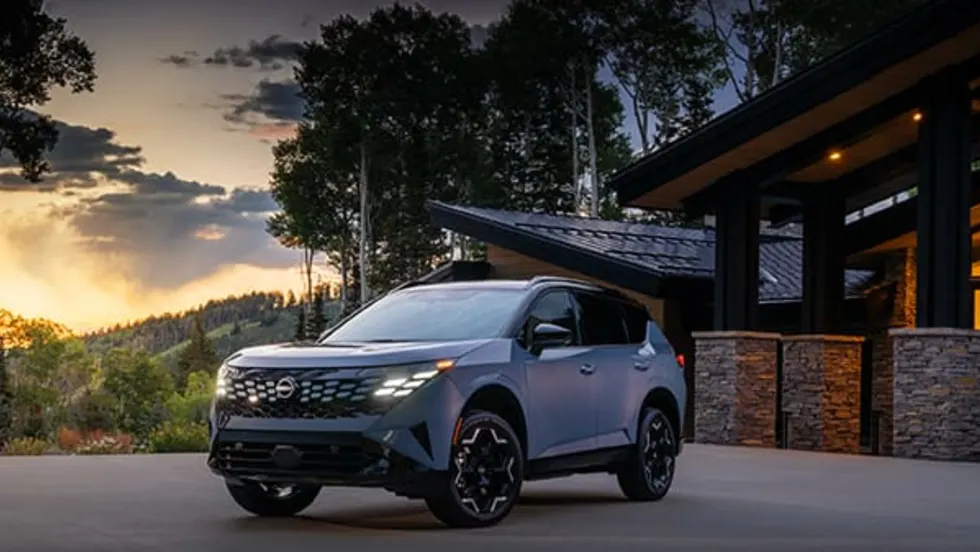
2027 Nissan Rogue Hybrid Adds e-POWER, Standard AWD
The new Rogue Hybrid uses Nissan’s e-POWER system with dual electric motors, offers an estimated 40 mpg and starts at $35,490.
Read More →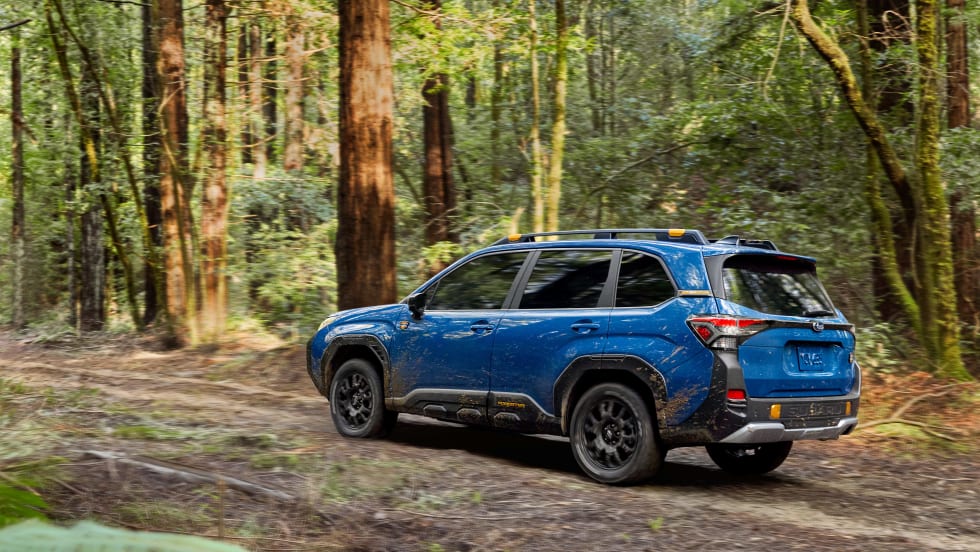
2027 Subaru Forester Adds First Wilderness Hybrid
The 2027 Forester lineup starts at $29,995 and adds a Wilderness Hybrid with 194 combined horsepower and 9.3 inches of ground clearance.
Read More →
EV Realty Names Henrik Holland President as Charging Platform Expands
The former Prologis Mobility and Shell executive will help expand EV Realty’s truck charging business and move its power-first infrastructure model into autonomous vehicle depots and other fleet sectors.
Read More →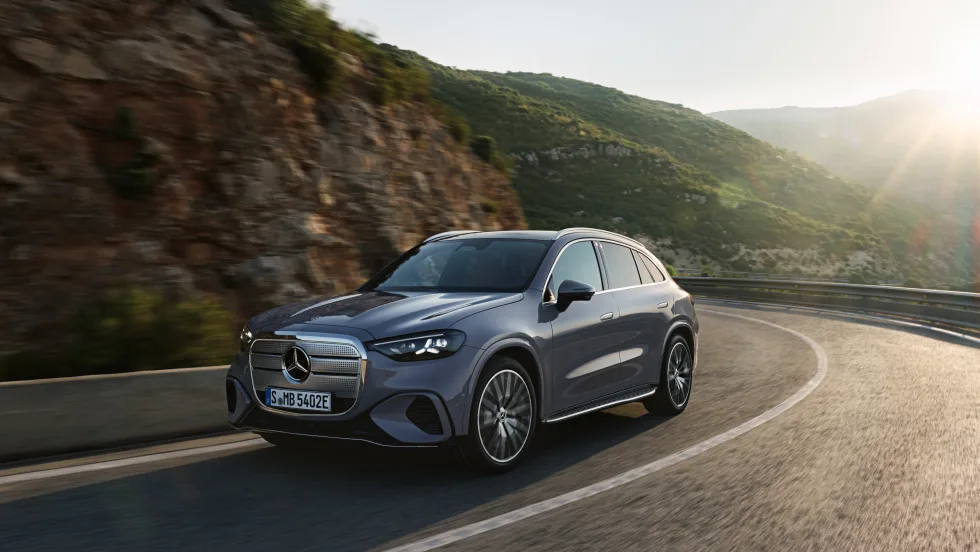
Mercedes-Benz Introduces Electric GLC With Up to 350 Miles of Range
The GLC 400 4MATIC Electric features an 800-volt architecture, 330-kW DC fast charging and a 94-kWh battery, along with Mercedes-Benz's new MB.OS operating system.
Read More →
Fleet Has a Talent Pipeline Problem, not a Talent Problem
Where will the next generation of fleet leaders come from, and what does the industry need to do differently to find them?
Read More →