

Data Behind Disasters
Visualizing the escalating risks of climate-related disasters across the U.S., highlighting the urgent need for comprehensive disaster preparedness and response strategies.
May 1, 2025

8 min to read
Disaster Prep: Planning by Geography
NUMBER OF BILLION-DOLLAR CLIMATE DISASTERS IN THE U.S.
Climate Disasters Causing $1 Billion + in Damage
.png)
TOP 20 STATES MOST AT RISK FOR BILLION-DOLLAR CLIMATE DISASTERS
Billion-Dollar Climate Disasters (2012-2022)
Rank | State | Total Number | Approximate Cost | Disaster Type | Occurrence2 |
|---|---|---|---|---|---|
1 | Texas | 84 | $225.0B | Severe Storm | 62 |
2 | Illinois | 52 | $35.0B | Severe Storm | 42 |
3 | Missouri | 51 | $15.0B | Severe Storm | 39 |
4 | Virginia (Tie) | 50 | $7.5B | Severe Storm | 29 |
5 | Georgia (Tie) | 50 | $15.0B | Severe Storm | 26 |
6 | North Carolina | 49 | $35.0B | Severe Storm | 24 |
7 | Oklahoma | 48 | $15.0B | Severe Storm | 36 |
8 | Alabama | 44 | $15.0B | Severe Storm | 27 |
9 | Tennessee | 43 | $15.0B | Severe Storm | 28 |
10 | South Carolina (Tie) | 42 | $15.0B | Severe Storm | 20 |
11 | Kansas (Tie) | 42 | $15.0B | Severe Storm | 32 |
12 | Pennsylvania | 40 | $15.0B | Severe Storm | 29 |
13 | Mississippi (Tie) | 39 | $7.5B | Severe Storm | 23 |
14 | Indiana (Tie) | 39 | $15.0B | Severe Storm | 32 |
15 | Ohio (Tie) | 38 | $15.0B | Severe Storm | 29 |
16 | Louisiana (Tie) | 38 | $150.0B | Severe Storm | 30 |
17 | New York (Tie) | 37 | $75.0B | Severe Storm | 23 |
18 | Colorado (Tie) | 37 | $35.0B | Severe Storm | 21 |
19 | Arkansas | 36 | $7.5B | Severe Storm | 26 |
20 | Maryland | 35 | $3.5B | Severe Storm | 21 |
1. This is the estimated cost of damage caused by billion-dollar weather events.
2. This is the number of billion-dollar weather events caused by the greatest potential hazard
Source: Forbes Advisor www.forbes.com/advisor/homeowners-insurance/natural-disaster-statistics/#one
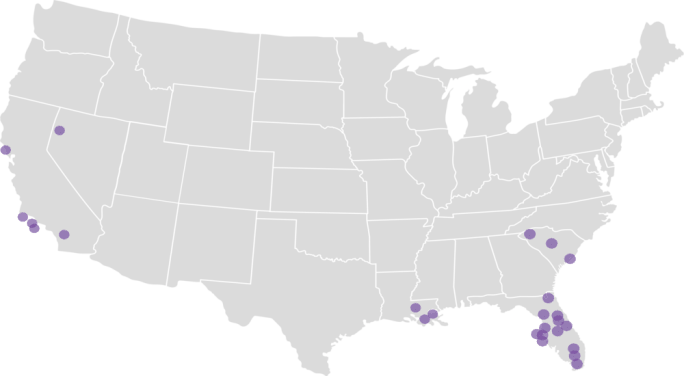
TOP 25 MOST DISASTER-PRONE COUNTIES
County ranking is determined by the number of FEMA disaster declarations between January 2013 and January 2023.
BREVARD COUNTY, FL
Rank: 13 (Tie) | 11 disasters were declared between 2013 and 2023.
Hurricanes are the most common disaster type, accounting for 10 disaster declarations over the past decade.
BROWARD COUNTY, FL
Rank: 13 (Tie) | 11 disasters were declared between 2013 and 2023
Hurricanes are the most common disaster type, accounting for 10 disaster declarations over the past decade.
CHARLESTON COUNTY, SC
Rank: 8 | 13 disasters were declared between 2013 and 2023.
Hurricanes are the most common disaster type, accounting for 10 disaster declarations over the past decade.
ORLEANS PARISH, LA
Rank: 2 (Tie) | 17 disasters were declared between 2013 and 2023
Hurricanes are the most common disaster type, accounting for 11 disaster declarations over the past decade.
DUVAL COUNTY, FL
Rank: 9 (Tie) | 12 disasters were declared between 2013 and 2023
Hurricanes are the most common disaster type, accounting for 10 disaster declarations over the past decade.
MARION COUNTY, FL
Rank: 13 (Tie) | 11 disasters were declared between 2013 and 2023
Hurricanes are the most common disaster type, accounting for 9 disaster declarations over the past decade.
RIVERSIDE COUNTY, CA
Rank: 4 (Tie) | 16 disasters were declared between 2013 and 2023.
Fires are the most common disaster type, accounting for 13 disaster declarations over the past decade.
EAST BATON ROUGE PARISH, LA
Rank: 2 (Tie) | 17 disasters were declared between 2013 and 2023.
Hurricanes are the most common disaster type, accounting for 10 disaster declarations over the past decade.
MIAMI-DADE COUNTY, FL
Rank: 13 (Tie) | 11 disasters were declared between 2013 and 2023.
Hurricanes are the most common disaster type, accounting for 8 disaster declarations over the past decade.
SANTA BARBARA COUNTY, CA
Rank: 13 (Tie) | 11 disasters were declared between 2013 and 2023.
Fires are the most common disaster type, accounting for 6 disaster declarations over the past decade.
GREENVILLE COUNTY, SC
Rank: 9 (Tie) | 12 disasters were declared between 2013 and 2023.
Hurricanes are the most common disaster type, accounting for 7 disaster declarations over the past decade.
OSCEOLA COUNTY, FL
Rank: 13 (Tie) | 11 disasters were declared between 2013 and 2023.
Hurricanes are the most common disaster type, accounting for 8 disaster declarations over the past decade.
SEMINOLE COUNTY, FL
Rank: 13 (Tie) | 11 disasters were declared between 2013 and 2023.
Hurricanes are the most common disaster type, accounting for 10 disaster declarations over the past decade.
HILLSBOROUGH COUNTY, FL
Rank: 13 (Tie) | 11 disasters were declared between 2013 and 2023.
Hurricanes are the most common disaster type, accounting for 9 disaster declarations over the past decade.
PALM BEACH COUNTY, FL
Rank: 13 (Tie) | 11 disasters were declared between 2013 and 2023
Hurricanes are the most common disaster type, accounting for 10 disaster declarations over the past decade.
SONOMA COUNTY, CA
Rank: 6 (Tie) | 14 disasters were declared between 2013 and 2023.
Fires are the most common disaster type, accounting for 10 disaster declarations over the past decade
JEFFERSON PARISH, LA
Rank: 4 (Tie) | 16 disasters were declared between 2013 and 2023
Hurricanes are the most common disaster type, accounting for 11 disaster declarations over the past decade.
PASCO COUNTY, FL
Rank: 13 (Tie) | 11 disasters were declared between 2013 and 2023.
Hurricanes are the most common disaster type, accounting for 9 disaster declarations over the past decade.
VENTURA COUNTY, CA
Rank: 9 (Tie) | 12 disasters were declared between 2013 and 2023.
Fires are the most common disaster type, accounting for 11 disaster declarations over the past decade.
LOS ANGELES COUNTY, CA
Rank: 1 | 22 disasters were declared between 2013 and 2023.
Fires are the most common disaster type, accounting for 20 disaster declarations over the past decade.
PINELLAS COUNTY, FL
Rank: 13 (Tie) | 11 disasters were declared between 2013 and 2023.
Hurricanes are the most common disaster type, accounting for 9 disaster declarations over the past decade.
VOLUSIA COUNTY, FL
Rank: 13 (Tie) | 11 disasters were declared between 2013 and 2023
Hurricanes are the most common disaster type, accounting for 10 disaster declarations over the past decade.
MANATEE COUNTY, FL
Rank: 9 (Tie) | 12 disasters were declared between 2013 and 2023.
Hurricanes are the most common disaster type, accounting for 10 disaster declarations over the past decade.
RICHLAND COUNTY, SC
Rank: 13 (Tie) | 11 disasters were declared between 2013 and 2023
Hurricanes are the most common disaster type, accounting for 8 disaster declarations over the past decade.
WASHOE COUNTY, NV
Rank: 6 (Tie) | 14 disasters were declared
between 2013 and 2023.
Fires are the most common disaster type, accounting for 12 disaster declarations over the past decade.
Disaster Prep: Planning by Number of Incidents
What Is the Most Common Natural Disaster?
Severe storms have been the most common natural disasters in the U.S. over the last 10 years among events that resulted in damages of at least $1 billion. Over the past decade, severe storms have caused the highest number of billion-dollar climate disasters (99), followed by tropical cyclones (24), flooding (17), droughts (10) and wildfires (9).
Counties Most at Risk for Natural Disasters
To determine which counties are most at risk for natural disasters, Forbes Advisor uncovered the number of Federal Emergency Management Agency (FEMA) disaster declarations over the past decade for the 200 mostpopulated counties.
According to Forbes Advisor analysis of these natural disasters facts, Los Angeles County, California, tops the list of counties most at risk for natural disasters, followed by East Baton Rouge Parish, Louisiana; Orleans Parish, Louisiana; Riverside County, California; and Jefferson Parish, Louisiana.
Coastal states are the most heavily impacted by natural disasters. Four California counties rank among the top 10 counties most at risk for natural disasters, along with three Louisiana parishes, two South Carolina counties, and two counties in Florida.
Fires and hurricanes were the most common disaster types for the top 10 counties most impacted by disasters.
Between January 2013 and January 2023, 88.5% of all U.S. counties declared a natural disaster, including 95% of the 200 most-populated counties.
Only 10 of the 200 most-populated counties didn’t declare a disaster over the past decade, five of which are located in Ohio.
States With the Highest Number of Flood Insurance Claims
The analysis of 2022 natural disasters finds that Washington has the highest number of flood insurance claims.
Washington tops the list of states with the highest number of flood insurance claims in 2022 (500), followed by Maryland (313), Texas (258), Alabama (242), and Florida (242).
Which State Has the Most Tornadoes?
Mississippi had the most tornadoes in 2022, followed by Texas and Alabama. Forbes Advisor analysis of natural disaster facts shows each of these three states experienced over 100 tornadoes in 2022.
Mississippi experienced the highest number of tornadoes in 2022 (184), followed by Texas (160), Alabama (117), Minnesota (77), and Florida (73).
Which State Has the Most Wildfires?
According to Forbes Advisor analysis, Texas tops the list of states most impacted by wildfires last year (12,571 fires burned 671,800 acres), followed by California (7,884 fires burned 309,287 acres), and Oklahoma (2,811 fires burned 385,133 acres).
Delaware ranked as the state least impacted by wildfires in 2022 (seven fires burned 79 acres), followed by Iowa (seven fires burned 288 acres), and Rhode Island (76 fires burned 44 acres).
Hurricane Statistics
The U.S. had a nearly normal hurricane season in 2022 with 10 recorded. The 2023 hurricane season was predicted to be slightly below average.
- A total of 301 hurricanes hit 19 U.S. states between 1851 and 2020.
- In 2022, the U.S. experienced 10 hurricanes in total, including two major hurricanes with winds that exceeded 111 miles per hour.
- Hurricanes caused 12 fatalities in 2021, and resulted in roughly $8.598 billion in property damage and $2 million in crop damage.
- More than 31.7 million single-family homes (and nearly 1 million multifamily homes) are at moderate or greater risk of being impacted by damaging hurricane winds.
- More than 22 million single-family homes and over 647,000 multi-family homes are at high or greater risk of hurricane wind damage.
1. National Centers for Environmental Information: Billion-Dollar Weather and
Climate Disasters
7. National Interagency Coordination Center
9. NOAA National Severe Storms Laboratory
10. NOAA: Hurricanes, Frequently Asked Questions
12. National Weather Service
13. CoreLogic
16. National Flood Insurance Program
18. Forbes Advisor - Counties Most at Risk for Natural Disasters, Ranked
Source: Forbes Advisor www.forbes.com/advisor/homeowners-insurance/natural-disaster-statistics/#one
Subscribe to Our Newsletter
More Disaster Response
From Storm Prep to Emergency Response: The Growing Role of Telematics in Disaster Management
Telematics is transforming disaster response by giving fleets real-time visibility, improving routing, readiness, and coordination when every second counts.
Read More →
Disaster Readiness Is Not a Fleet Count, It’s a Stress Test of the Whole System
Fleet readiness isn’t about your vehicle count. It’s about condition, capacity, and whether your system can actually perform under stress.
Read More →
How Fleets Keep Fuel Flowing During Disasters
U.S. Bank Voyager explains the most common fleet payment failures during emergencies and how proactive planning helps keep vehicles moving when conditions deteriorate.
Read More →
The Waffle House Effect: How They Impacted How Storms are Measured While Keeping Hot Meals Ready
Why one restaurant chain became a benchmark for disaster response and what fleets can learn about readiness, operations, and recovery.
Read More →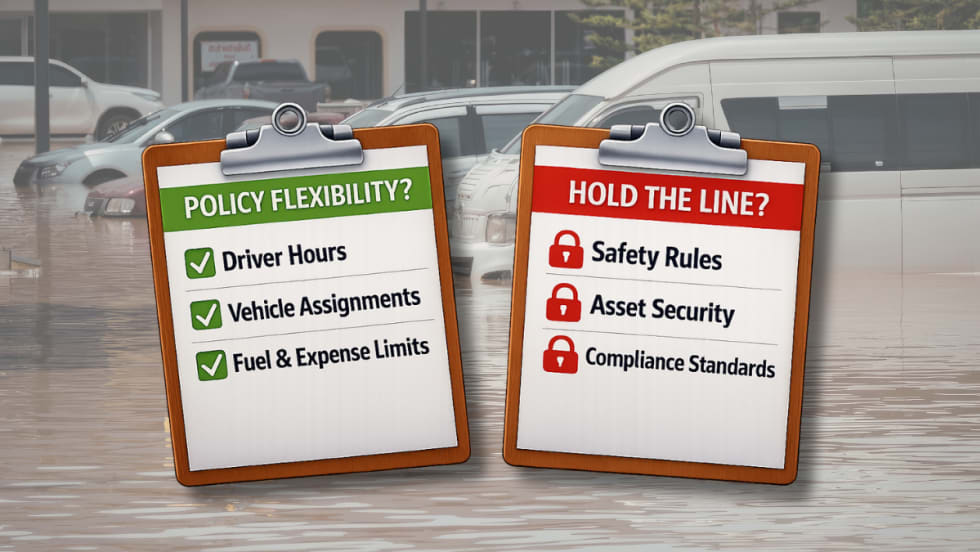
Adapting Fleet Policy When Disasters Strike
In the middle of natural disasters fleet managers must shift priorities to protect people and assets. What policy items should be loosened, and when should the line be held?
Read More →
When Fuel Runs Out, the Fleet Plan Falls Apart
When disaster hits, fleets fail on fuel, power, and idle planning. See the energy gaps fleet managers need to fix before the next storm.
Read More →
The Missing Data Point in Disaster Response
Human reports fill the gaps that telematics can’t during disasters. Here’s how fleets can use structured input (not social chaos) to respond faster and safer.
Read More →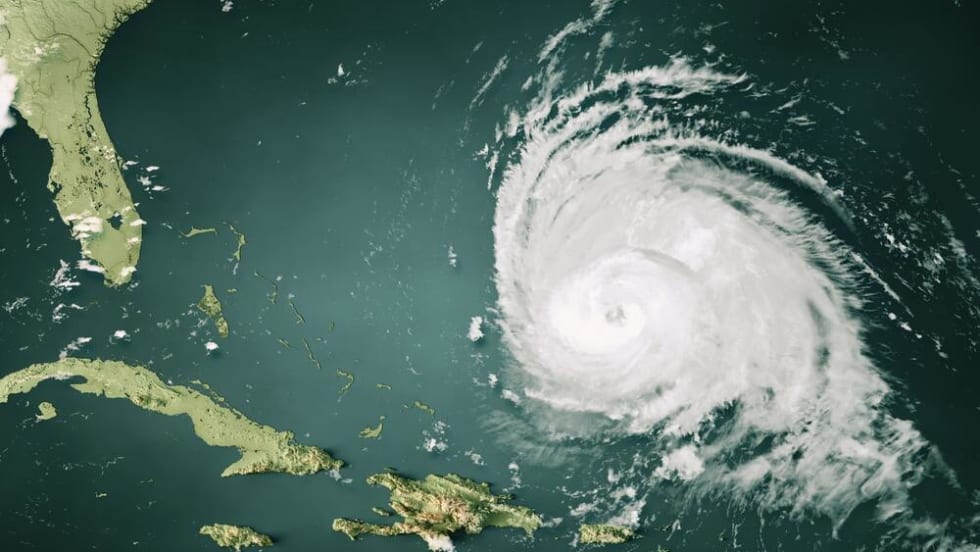
Essential Strategies for Fleet Preparation and Protection During Hurricane Season
Prepare your fleet for hurricane season with proactive strategies to protect drivers, vehicles, and assets before, during, and after the storm.
Read More →
When Disaster Strikes: Equipping Your Fleet for Survival and Recovery
Discover how fleets can stay operational during hurricanes, wildfires, floods, and storms with strategic planning, technology, and data-driven maintenance.
Read More →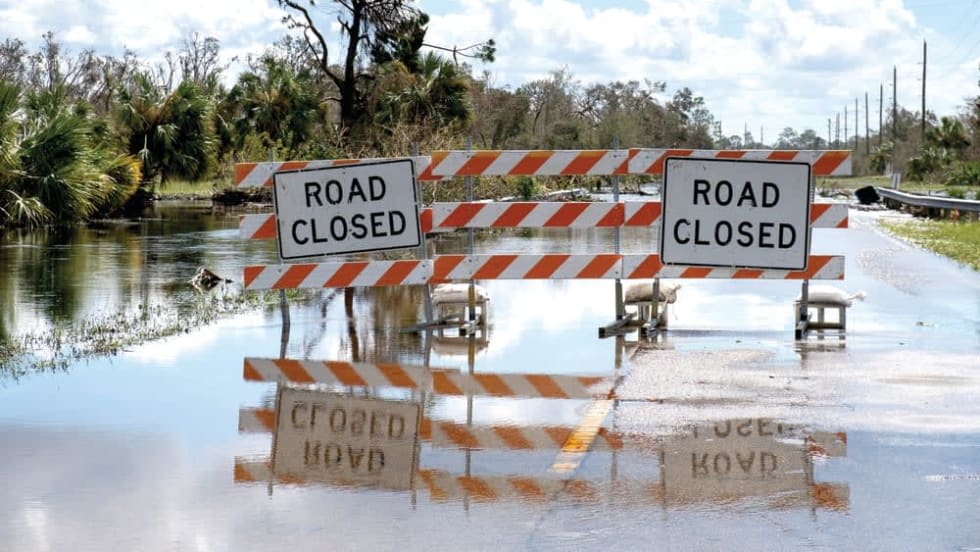
Mobilizing for Recovery When it Matters Most
When disaster strikes, reliable transportation becomes a lifeline for recovery, ensuring first responders and relief crews can reach those in need most.
Read More →