

3 Case Studies and Data Lessons with Forward Intention
Discover powerful data insights from three major disasters (hurricanes, snowstorms, and wildfires), revealing how mobility patterns shape preparedness and recovery.
May 1, 2025

Mobility data maps reveal movement patterns during disasters, aiding in effective emergency response planning.
Getty Images/FrankRamspott
5 min to read
There is hope that data collected from multiple sources will soon provide actionable insights into how to better move people, goods, and services in preparation, evacuation, and recovery from a storm.
Altitude by Geotab has presented findings at our BBM Fleet Forward conferences in recent years that dive into future tech and where data, safety, and sustainability are heading. I was impressed by a recent Altitude e-book that shared data insights from three recent disasters, which are summarized below.
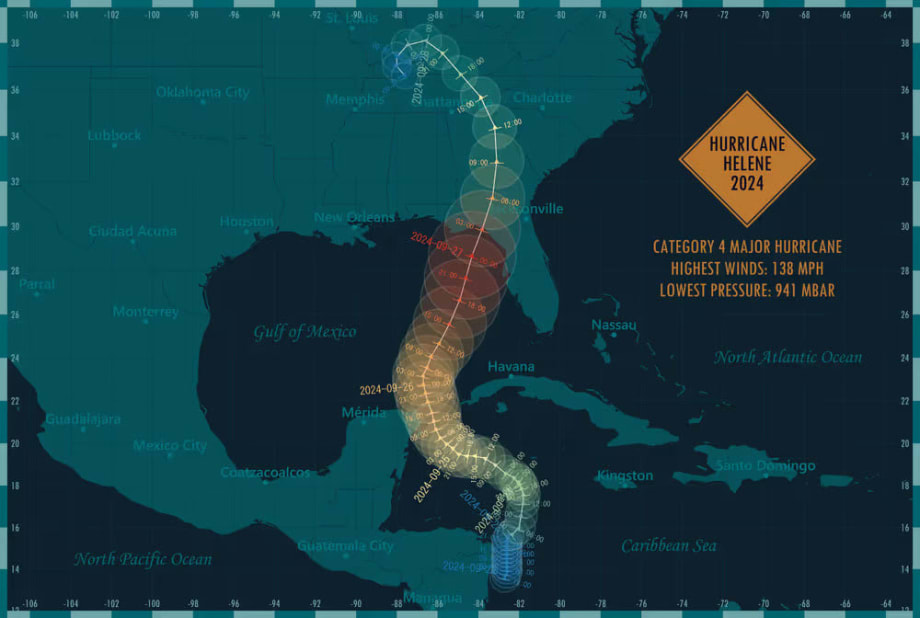
After the Storm – Lessons from Hurricane Helene’s Disruption in North Carolina
When Hurricane Helene slammed into North Carolina in late September 2024, it wasn’t just wind and water that brought the state to a halt, it was a complete collapse of movement. Roads disappeared under floodwaters. Bridges were torn away. Aid and rescue efforts stalled not from lack of urgency, but from a landscape rendered unnavigable.
Commercial vehicle traffic told a quiet but telling story in the days surrounding the storm. Two days before landfall, volumes dropped as drivers rerouted or stayed home. By the time Helene’s rains hit, traffic in western regions like Asheville had nearly vanished. Even after the skies cleared, the region’s transportation arteries remained choked, some by standing water, others by structural damage that would take weeks or months to repair.
This wasn’t just a matter of convenience. Emergency response was slowed. Freight routes were disrupted. The real cost wasn’t measured in gallons of water, but in hours lost, deliveries missed, and lives complicated by an invisible barrier: inaccessibility.
Satellite data and vehicle movement analytics — used retrospectively — help us map this disruption in striking detail. Roads that normally buzz with activity appeared silent. Travel “hotspots” turned cold. The recovery was as uneven as the storm’s path, with some areas bouncing back quickly and others lagging behind due to the damage to their infrastructure.
Helene made it clear that disaster preparedness can’t start when the clouds roll in. It begins with understanding how a region moves and how quickly that movement can grind to a halt. The state’s recovery wasn’t just physical; it was logistical. And if we’re to build real resilience into our infrastructure, we need to see traffic patterns not just as data points, but as lifelines.
Icebound – What New York’s Winter Storms Revealed About Road Resilience
In January 2024, two back-to-back winter storms swept through western New York, blanketing the region in heavy snow and sleet. While the images of snow-covered highways and stranded vehicles told one part of the story, a deeper narrative unfolded beneath the surface; one of slowed movement, cautious behavior, and infrastructure pushed to its edge.
Between January 13 and 18, roadways in Erie, Genesee, and Niagara counties saw sharp drops in commercial vehicle traffic. Traffic volume fell by over 60% at the height of the storms, and miles driven dropped even further. Major arteries like I-90 were technically closed, but still saw some movement, likely from drivers unwilling or unable to find alternatives. The result: isolated pockets of activity amid widespread paralysis.
But this storm didn’t just slow traffic, it changed behavior. Data on harsh driving events showed subtle shifts: less aggressive acceleration, braking, and cornering. Drivers were proceeding with caution, aware that even routine maneuvers could turn risky on icy roads. Meanwhile, average travel times ballooned — by as much as 233% in some counties — turning short hauls into grueling treks.
Perhaps the most telling was what happened when vehicles stopped. The average roadside stop nearly doubled in duration. Drivers either had nowhere safe to go or simply waited out the worst conditions. Buffalo and its neighboring towns became clusters of long, unintended layovers.
The lesson? Winter weather doesn’t just inconvenience fleets and businesses, it restructures mobility. Emergency plans must account not only for closures, but also for the behavioral adaptations they trigger. Slower speeds, longer stops, and rerouted journeys aren’t anomalies; they’re predictable responses. Understanding these patterns means we’re better equipped to survive the next storm and keep people and goods moving through it.
In the Fire Zone – Mobility Lessons from Los Angeles’ Wildfire Crisis
When the Palisades and Eaton wildfires ignited across Los Angeles in January 2025, it wasn’t just homes and hillsides that burned, it was the delicate choreography of movement across a vast, urban ecosystem. With wind gusts exceeding 80 mph and tens of thousands of acres scorched, the fires didn’t just threaten lives; they disoriented entire communities trying to flee, respond, or return.
Mobility data from those weeks paints a stark picture. In the days leading up to the fires, vehicle volumes were steady. Then came the collapse. Roadways in Santa Monica, Topanga Canyon, and Altadena emptied.
Evacuation routes eastward (toward Culver City and Mid-City) saw corresponding spikes. This was not just chaos; it was directional. People fled with purpose, even if the routes they chose weren’t preordained by planners.
But unlike a hurricane or snowstorm, fire is unpredictable. Its path is shaped by wind, not weather forecasts. By January 9, vehicle volumes around Palisades Park had plummeted, while traffic slowly shifted to less-affected zones. In Altadena, however, the response was more scattered. There, movement slowed without a clear directional trend, suggesting confusion, limited evacuation capacity, or infrastructural constraints.
Over time, recovery became visible. By January 17, traffic volumes around both fire zones edged back toward normal. Aid efforts? Returning residents? Likely, both were contributors. But the key takeaway is this: Fire may be fast, but its mobility shadow lingers.
We often think of wildfires as natural disasters, but they also produce transportation disasters. Understanding how people evacuate — where they go, how quickly they leave, and when they return — offers planners a map not just of movement but of vulnerability. The roads we take in a crisis are more than concrete; they are choices, patterns, and, ultimately, indicators of how prepared we truly are.
Download the ‘Altitude by Geotab’ e-books at altitude.geotab.com
Subscribe to Our Newsletter
More Disaster Response
From Storm Prep to Emergency Response: The Growing Role of Telematics in Disaster Management
Telematics is transforming disaster response by giving fleets real-time visibility, improving routing, readiness, and coordination when every second counts.
Read More →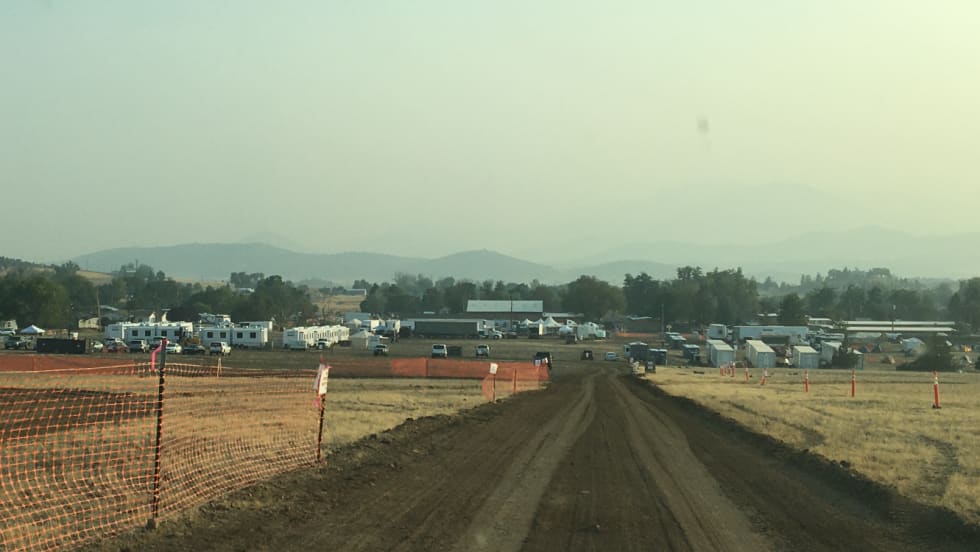
Disaster Readiness Is Not a Fleet Count, It’s a Stress Test of the Whole System
Fleet readiness isn’t about your vehicle count. It’s about condition, capacity, and whether your system can actually perform under stress.
Read More →
How Fleets Keep Fuel Flowing During Disasters
U.S. Bank Voyager explains the most common fleet payment failures during emergencies and how proactive planning helps keep vehicles moving when conditions deteriorate.
Read More →
The Waffle House Effect: How They Impacted How Storms are Measured While Keeping Hot Meals Ready
Why one restaurant chain became a benchmark for disaster response and what fleets can learn about readiness, operations, and recovery.
Read More →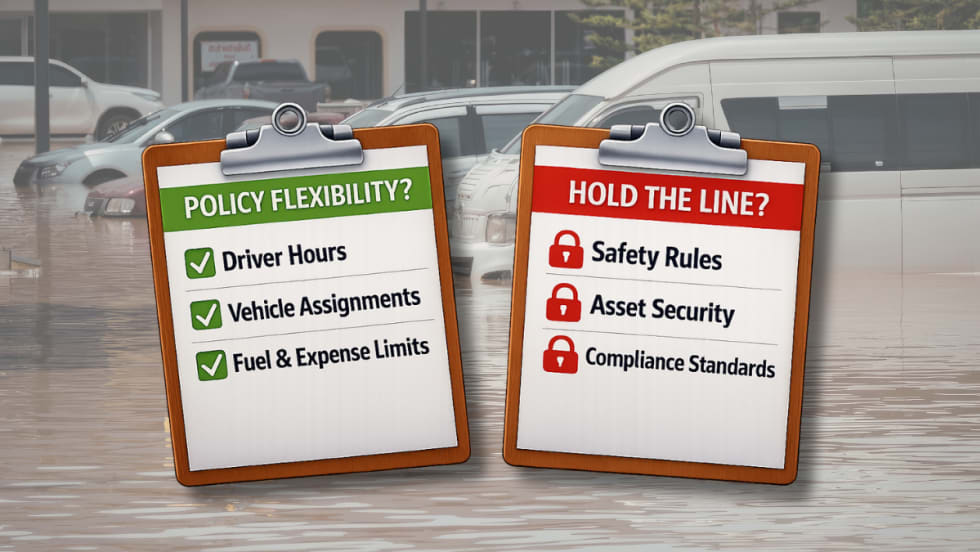
Adapting Fleet Policy When Disasters Strike
In the middle of natural disasters fleet managers must shift priorities to protect people and assets. What policy items should be loosened, and when should the line be held?
Read More →
When Fuel Runs Out, the Fleet Plan Falls Apart
When disaster hits, fleets fail on fuel, power, and idle planning. See the energy gaps fleet managers need to fix before the next storm.
Read More →
The Missing Data Point in Disaster Response
Human reports fill the gaps that telematics can’t during disasters. Here’s how fleets can use structured input (not social chaos) to respond faster and safer.
Read More →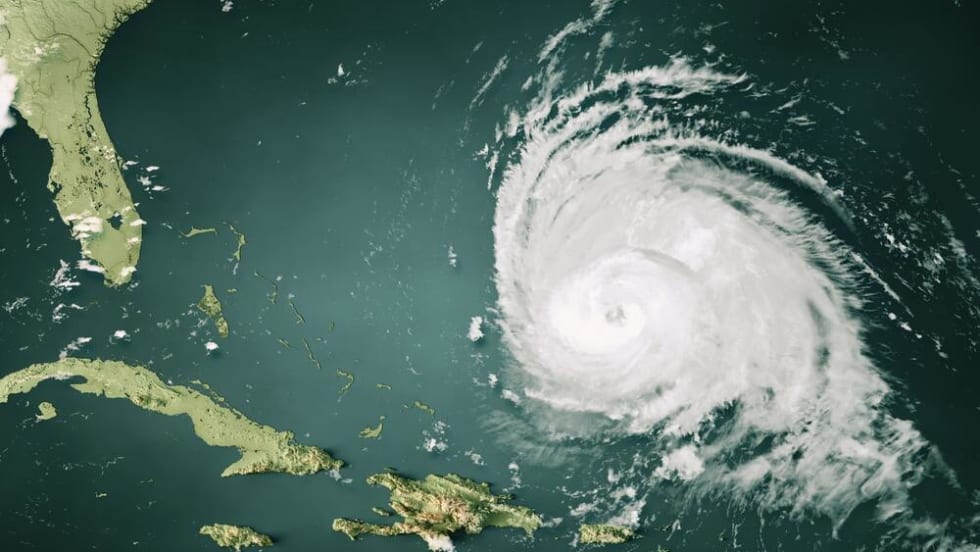
Essential Strategies for Fleet Preparation and Protection During Hurricane Season
Prepare your fleet for hurricane season with proactive strategies to protect drivers, vehicles, and assets before, during, and after the storm.
Read More →
When Disaster Strikes: Equipping Your Fleet for Survival and Recovery
Discover how fleets can stay operational during hurricanes, wildfires, floods, and storms with strategic planning, technology, and data-driven maintenance.
Read More →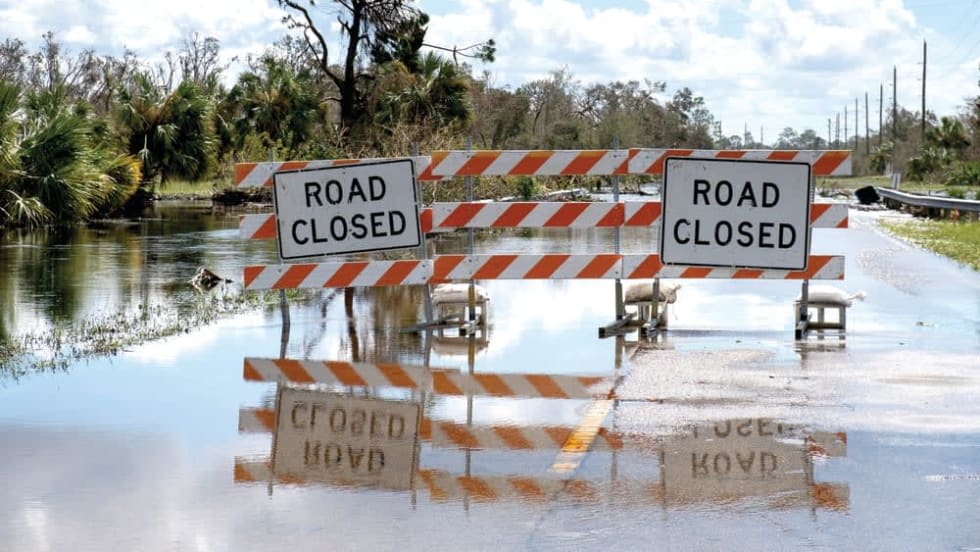
Mobilizing for Recovery When it Matters Most
When disaster strikes, reliable transportation becomes a lifeline for recovery, ensuring first responders and relief crews can reach those in need most.
Read More →