


Use this vehicle research tool to compare lifecycles costs and fleet incentives by model & class.
Carbon Emissions Vs. Ownership Costs: Compact SUVs
When comparing a vehicle’s carbon emissions and its total cost of ownership, which vehicles and powertrain types in the compact SUV segment offer the maximum benefit for the money? [Part 1 of 5]
February 11, 2025
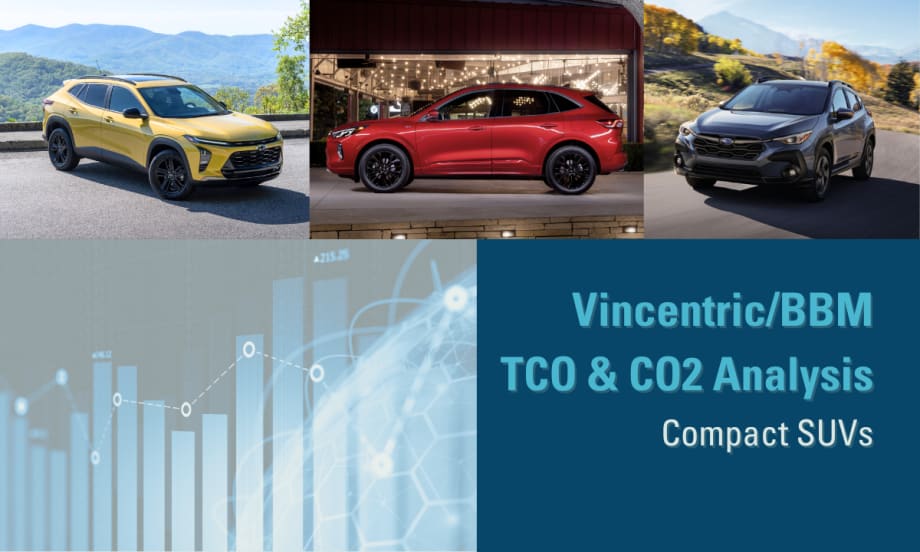
Compact SUVs, a favorite of corporate fleets, have the most model choices and powertrains of any passenger vehicle segment, covering ICE, BEV, HEV, and PHEV.
Photo: BBM
4 min to read
For most corporate fleet managers, balancing sustainability initiatives while keeping fleet costs in check is a top priority. Yet sourcing vehicles’ carbon emissions, matching them to vehicle routes, defining ownership costs, and then performing the cost-benefit analysis is a time and resource-consuming endeavor.
This study may help overcome these initial hurdles. We asked the lifecycle cost experts at Vincentric to provide total cost of ownership (TCO) data for 2024 model-year vehicles driven 20,000 miles per year for five years in these categories: half-ton pickups, cargo vans, passenger cars, compact SUVs, and luxury vehicles.
The resulting list produced close to 1,300 total vehicle configurations with gas and diesel (ICE), battery electric (BEV), hybrid electric (HEV), and plug-in hybrid electric (PHEV) powertrains.
As usual, Vincentric calculated its standard eight cost elements: depreciation, financing, fees and taxes, fuel, insurance, maintenance, opportunity cost, and repairs. This time, Vincentric also provided annual in-use carbon (CO2) emissions for each vehicle.
We divided the analysis by segment, with Compact SUVs being the first one. But first:
How Carbon Emissions Are Calculated
Vincentric broke out four sets of CO2 emissions by metric tons per year:
Electric generated (BEVs and PHEVs): Defined by the amount of CO2 emissions produced by power plants needed to power these vehicles.
Tank-to-wheel (ICE & HEV): Defined by the amount of CO2 emissions produced from burning fuel within a vehicle while the vehicle is in motion.
Well-to-tank (ICE & HEV): CO2 emissions produced from extracting, refining, and delivering fuel to the vehicle.
Annual in-use CO2 emissions: Totals the above three values for all vehicles in a single value demonstrating the yearly release of CO2 and Nitrous Oxide.
With this data, Automotive Fleet calculated the average annual in-use CO2 emissions and TCO for every vehicle configuration, sorted by vehicle segment. We then calculated the average percentage improvement in CO2 emissions when switching from an ICE engine to a BEV, HEV, BEV, or PHEV.
AF also included the top 5 TCO performers in each segment.
On to the analysis:
Compact SUVs
The compact SUV segment is a favorite of corporate fleets. It certainly has the most model choices and powertrains, covering ICE, BEV, HEV, and PHEV.
ICE: 189 configurations
5-Yr TCO Average: $71,654
Average yearly CO2 output (metric tons): 8.68
The ICE category is the biggest by far and offers the most vehicle configurations. Eight of the top 10 spots are versions of the Subaru Crosstrek and Chevrolet Trax.
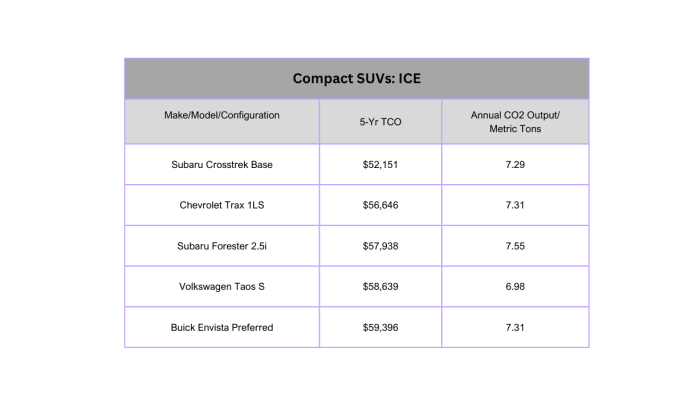
Eight of the top 10 spots are versions of Subaru Crosstrek and Chevrolet Trax.
Source: BBM
BEVs: 55 configurations
5-Yr TCO Average: $80,953
Average 5-Yr premium BEV over ICE: $9,299
Average yearly CO2 output (metric tons): 2.72
Average yearly CO2 savings by switching from ICE to BEV: 69%
As is the case in every segment, BEV configurations offer the lowest carbon output of any powerplant type. When transitioning from ICE to compact SUVs, BEVs in this segment offer a substantial 69% average reduction in carbon emissions.
But that benefit comes at a price. Compact SUVs have an average five-year/100,000-mile TCO of $9,299 per vehicle more than the average TCO of ICE models.
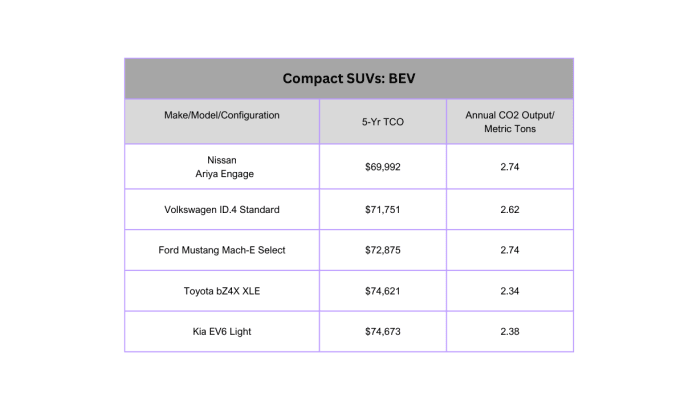
BEV configurations offer the lowest carbon output of any powerplant type, but it comes at a cost.
Source: BBM
PHEVs: 16 Configurations
5-Yr TCO Average: $81,205
Average 5-Yr premium PHEV over ICE: $9,551
Average yearly CO2 output (metric tons): 5.73
Average yearly CO2 savings by switching from ICE to BEV: 34%
Of the five segments analyzed, the compact SUV segment has PHEV variants in popular fleet models. PHEV versions of Ford Escape, Hyundai Tucson, and Jeep Wrangler took the top five TCO spots.
These PHEVs offer an average 34% reduction in carbon emissions. However, the average TCO premium for PHEVs is more than for BEVs, with slightly less CO2 savings.
Note that Vincentric assumes 100% battery use for all trips with its PHEVs. Real-world battery use is uneven — and often half or less than 100% — which would further erode any savings in carbon emissions and overall TCO.
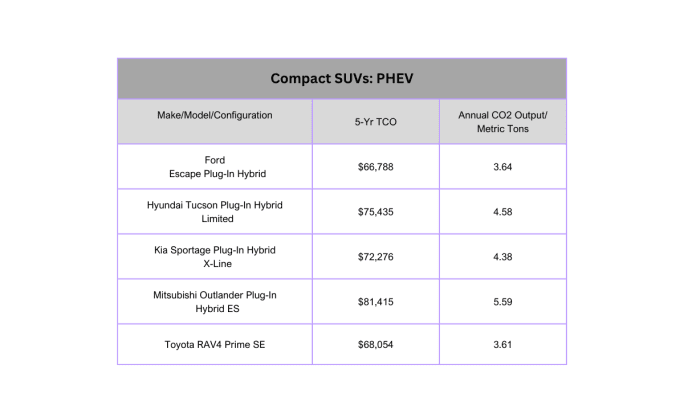
The average TCO premium for PHEVs is more than for BEVs, with slightly less CO2 savings.
Source: BBM
HEVs: 24 Configurations
5-Yr TCO Average: $64,469
Average 5-Yr premium HEV over ICE: -$7,185
Average yearly CO2 output (metric tons): 5.63
Average yearly CO2 savings by switching from ICE to HEV: 35%
In this segment, versions of the Toyota RAV4 Hybrid took all five top spots.
The hybrid models offer the best TCO of any powerplant in this analysis — and it’s not at a premium, but savings of over $7,000 on average per vehicle over five years compared to ICE models. This is combined with a 35% carbon reduction, surprisingly better than PHEVs.
While BEVs offer almost double the carbon savings, the strong TCO offered by hybrids provides an incremental yet meaningful path toward sustainability targets while conserving the fleet budget.
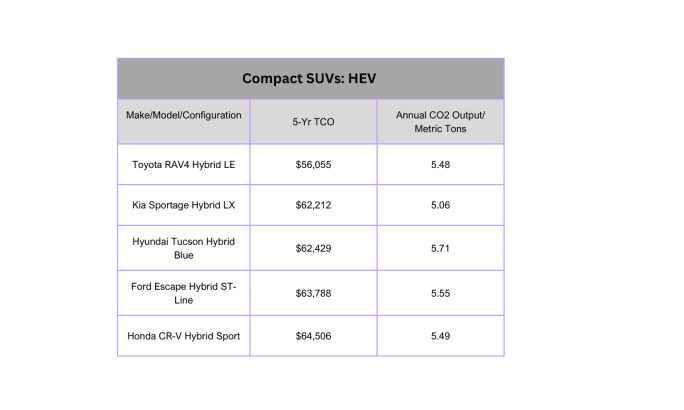
In this segment, hybrids offer savings of over $7,000 on average per vehicle compared to ICE models.
Source: BBM
Notes & Cautions
This analysis is meant to be directional only. It does not account for nuances in the capacities and capabilities of individual models within a segment.
The overall list includes manufacturers that don’t have a formal fleet program. They were included in the averages but not in our top 5 lists.
Often, one model dominates the top 5 TCO list. We point these cases out in the text. For the list, we include the top model’s best TCO configuration and move on to the next best-performing model.
Subscribe to Our Newsletter
More Vehicle Research

Sponsored•July 23, 2026
The Top 300 Commercial Fleets
The Top 300 Commercial Fleets: See the List
Read More →
2027 Toyota Prius Receives Technology, Comfort Update
The hybrid adds dual-zone climate control for 2027 while retaining its fifth-generation hybrid system and Toyota Safety Sense 3.0.
Read More →
Leaders, Data, and the Future of Mobility | AF News Recaps
From Fleet Manager of the Year finalists to connected vehicle privacy and the future of urban mobility, this week's biggest fleet stories are all about where the industry is headed next. Here's your Weekly Cheat Sheet.
Read More →
2027 Toyota Corolla Hatchback Adds Digital Displays, Technology Updates
Compact hatchback receives larger standard displays, new wheel and color options, and continues with a 169-hp four-cylinder engine.
Read More →

Teletrac Navman Begins Next Chapter as Standalone Private Company
What's new with Teletrac Navman and its new owner?
Read More →
Subaru Announces Pricing for 2027 Subaru Uncharted
Subaru has announced pricing for the 2027 Uncharted EV, which returns with no price increase, an estimated range of more than 300 miles, and a starting MSRP of $34,995.
Read More →
What Should We Make of the Fiat Topolino?
This atypical low-speed vehicle is coming to the U.S. It's smaller than a Smart Fortwo and starts at $13,995.
Read More →
USPS, Zipcar, DPD UK, and Others Named Winners of The Optimizers Awards 2026
USPS, Zipcar, DPD UK, and other fleet organizations were recognized in the 2026 Optimizers Awards for initiatives involving route optimization, automation, AI, and fleet utilization.
Read More →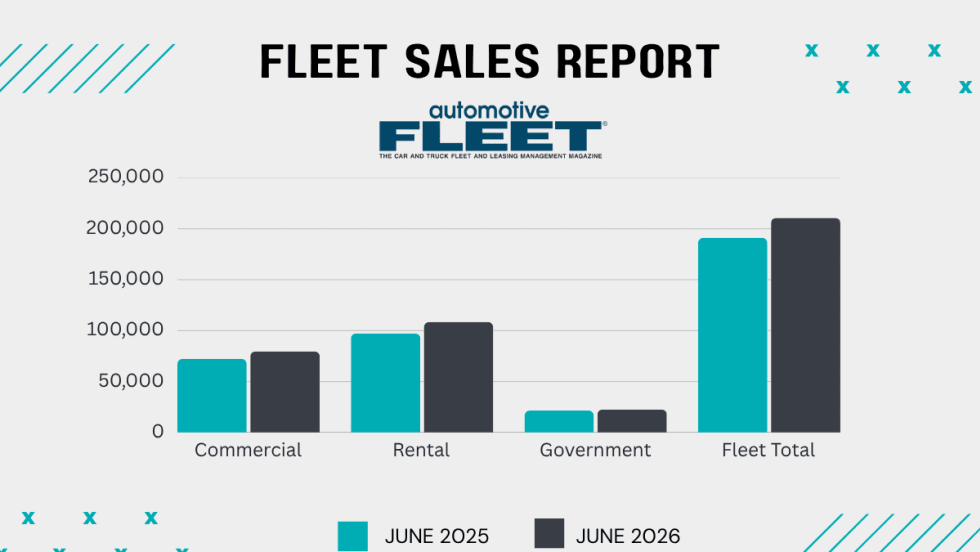
Commercial Fleet Sales Contribute To June, YTD Gains
The fleet sector has boosted its vehicle purchases at a reliable pace in the first half of this year compared with 1H 2025.
Read More →