


Check Out Last Month! Christmas Comes Early at the Pump: Gas Averages $2.79 Nationwide
January Fuel Update: Prices Hit Highest Level Since Summer
The national average for fuel prices has officially risen to its highest point since the summer.
January 28, 2026
Oil prices jumped past $60, pushing national averages to their highest point since this summer.
Photo: EIA/Automotive Fleet
6 min to read
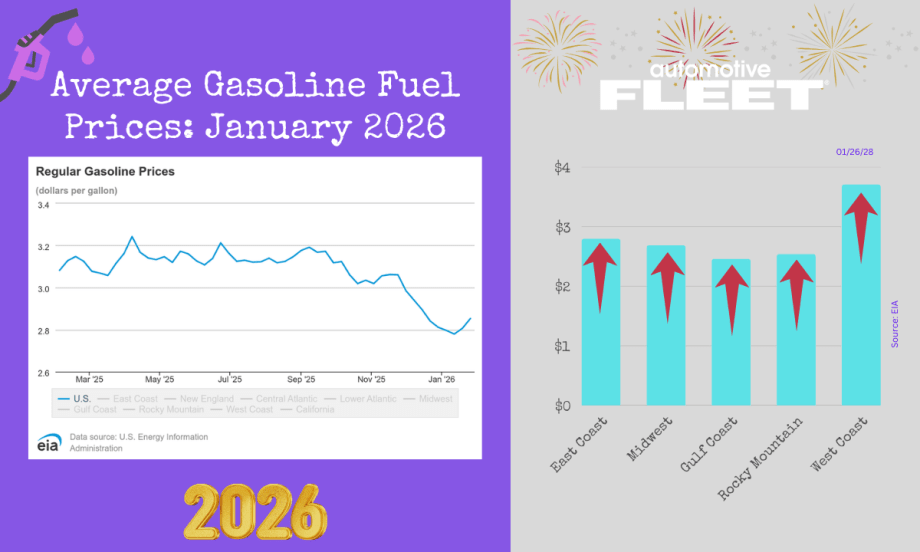
U.S Regional Gasoline Prices as of January 26, 2026
According to GasBuddy data compiled from more than 12 million individual price reports covering over 150,000 gas stations across the country, the national average for fuel has risen 7.5 cents over the last week to $2.84 per gallon.
This is up 3.6 cents from a month ago and 23.9 cents lower per gallon than a year ago.
“Average gasoline prices have jumped for a second straight week as oil prices have climbed back above the $60-per-barrel mark amid ongoing geopolitical tensions,” said Patrick De Haan, head of petroleum analysis at GasBuddy. “New sanctions on Iran’s oil are making it more difficult for those barrels to reach the market, tightening supply, while the major winter storm that sent temperatures plunging is also likely to impact refineries, causing disruptions and reduced output. Diesel prices have jumped as colder weather boosts demand for heating oil, a combination that could keep both gasoline and diesel prices moving higher in the week ahead.”
Here’s a look at prices by region according to EIA data, as of January 26:
East Coast: $2.80
Midwest: $2.69
Gulf Coast: $2.46
Rocky Mountain: $2.54
West Coast: $3.71
All regions saw an increase in prices this week.
Here are the top 10 cheapest states to buy gas, according to AAA data:
Rank | State | Regular |
|---|---|---|
1 | Oklahoma | $2.41 |
2 | Arkansas | $2.43 |
3 | Mississippi | $2.45 |
4 | Louisiana | $2.47 |
5 | Kansas | $2.48 |
6 | Texas | $2.49 |
7 | Missouri | $2.50 |
8 | Alabama | $2.53 |
9 | North Dakota | $2.53 |
10 | Tennessee | $2.53 |
U.S Regional Gasoline Prices as of January 19, 2026
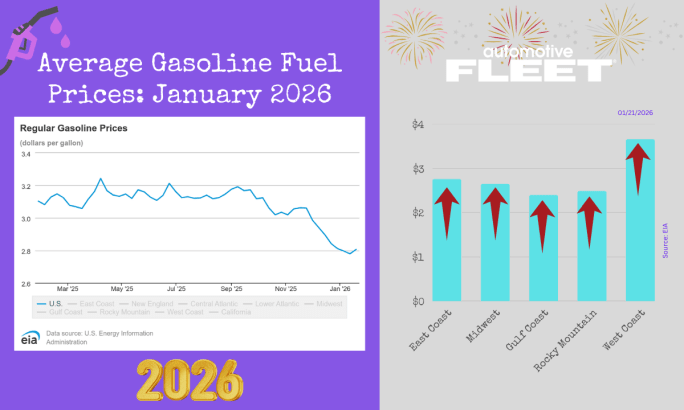
Oil prices have risen once again, and along with them, the national fuel price average has risen to $2.76 per gallon.
Photo: EIA/Automotive Fleet
Fuel prices have officially ended their seven-week slide.
“After seven straight weeks of declines, the national average price of gasoline has moved higher, breaking the streak as oil prices have climbed back near $60 per barrel after dipping into the mid-$50s,” said Patrick De Haan, head of petroleum analysis at GasBuddy.
According to GasBuddy data compiled from more than 12 million individual price reports covering over 150,000 gas stations across the country, the national average for fuel has risen 3.1 cents over the last week and stands at $2.76 per gallon.
This is down 8.6 cents from a month ago and 32.3 cents lower per gallon than a year ago.
“There’s still a window of opportunity to revisit—or even beat—recent gas price lows, but that window will begin to close soon. California will soon start transitioning back to cleaner summer gasoline, with most of the rest of the country following in a little over a month. However, with a surplus of winter gasoline built up after large inventory increases in recent weeks, we’re likely to see localized discounts as that fuel is cleared from the system before the seasonal rise becomes more organized in the weeks ahead.”
Here’s a look at prices by region according to EIA data, as of January 19:
East Coast: $2.76
Midwest: $2.65
Gulf Coast: $2.40
Rocky Mountain: $2.49
West Coast: $3.66
All regions saw prices rise this week.
Here are the top 10 cheapest states to buy gas, according to AAA data:
Rank | State | Regular |
|---|---|---|
1 | Oklahoma | $2.34 |
2 | Kansas | $2.43 |
3 | Arkansas | $2.43 |
4 | Mississippi | $2.44 |
5 | Texas | $2.45 |
6 | Louisiana | $2.46 |
7 | Missouri | $2.47 |
8 | Tennessee | $2.47 |
9 | Wisconsin | $2.47 |
10 | Iowa | $2.47 |
U.S Regional Gasoline Prices as of January 12, 2026

In light of recent events in Venezuela and a slight increase in oil prices, experts are considering a reality in which that trend doesn't last.
Photo: EIA/Automotive Fleet
According to GasBuddy data compiled from more than 12 million individual price reports covering over 150,000 gas stations across the country, the national average for fuel has dropped 0.8 cents this week and currently stands at $2.73 per gallon.
This is down 17.0 cents from a month ago and 28.9 cents lower than a year ago. While most national prices didn't jump, a select few price-cycling states saw some notable increases.
Patrick De Haan, head of petroleum analysis at GasBuddy, recently reported on the effects of the situation in Venezuela.
“The good news is that once prices rise in these markets, they often retreat for a week or longer afterward. While the situation in Venezuela has dominated headlines, it’s far too early for any measurable impact on what consumers are paying at the pump — whether prices go up or down — as it would likely take years to see a meaningful increase in oil output there. For now, gas prices remain seasonally lower, but with oil prices inching higher, the national average could soon see some limited upward movement.”
Here’s a look at prices by region according to EIA data, as of January 12:
East Coast: $2.74
Midwest: $2.60
Gulf Coast: $2.38
Rocky Mountain: $2.42
West Coast: $3.65
The East and West Coasts experienced a decrease in prices.
Here are the top 10 cheapest states to buy gas, according to AAA data:
Rank | State | Regular |
|---|---|---|
1 | Oklahoma | $2.23 |
2 | Arkansas | $2.39 |
3 | Texas | $2.40 |
4 | Kansas | $2.41 |
5 | Missouri | $2.43 |
6 | Mississippi | $2.43 |
7 | Louisiana | $2.43 |
8 | Tennessee | $2.48 |
9 | Alabama | $2.49 |
10 | Iowa | $2.49 |
U.S Regional Gasoline Prices as of January 5, 2026
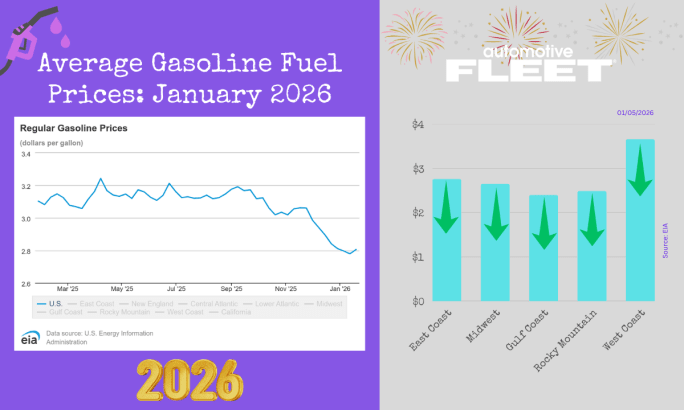
The 2026 projected fuel outlook estimates a national average of $2.97, with the first week of January falling 2.1 cents after hectic Christmas travel.
Photo: EIA/Automotive Fleet
The 2026 projected fuel outlook forecasted a record-low yearly average of below $3.
“Another week, and motorists have been greeted with the sixth straight weekly decline in the national average price of gasoline as seasonality continues to drive trends at the pump,” said Patrick De Haan, head of petroleum analysis at GasBuddy.
For the week of January 5, the national average fell 1.2 cents to $2.74 per gallon, according to GasBuddy data compiled from more than 12 million individual price reports covering over 150,000 gas stations across the country.
The national average is down 21.2 cents from a month ago and 29.2 cents lower than a year ago.
“While more states did see prices rise this week, most of those increases were in ‘price-cycling’ markets, where routine jumps often follow larger declines. Elsewhere, most states saw prices inch lower again. And with GasBuddy’s 2026 Fuel Outlook set for release this week, we’ll soon have a clearer sense of what drivers may face next year — particularly as new developments in Venezuela put fresh attention on the global oil market. Some Americans believe gasoline prices could be impacted in a significant way, but I’m here to throw a bit of cold water on that. Even under the most optimistic outcomes, it could take years of positive developments for additional supply to meaningfully move the needle, and the impact on U.S. gasoline prices may ultimately be limited. For now, I expect gas prices to bottom out in the weeks ahead before beginning their seasonal climb toward March.”
Here’s a look at prices by region according to EIA data, as of January 5:
East Coast: $2.78
Midwest: $2.59
Gulf Coast: $2.37
Rocky Mountain: $2.40
West Coast: $3.71
All regions once again saw a decrease in prices.
Here are the top 10 cheapest states to buy gas, according to AAA data:
Rank | State | Regular |
|---|---|---|
1 | Oklahoma | $2.24 |
2 | Iowa | $2.35 |
3 | Colorado | $2.39 |
4 | Texas | $2.39 |
5 | Arkansas | $2.39 |
6 | Wisconsin | $2.41 |
7 | Kansas | $2.43 |
8 | Mississippi | $2.45 |
9 | Missouri | $2.45 |
10 | Louisiana | $2.45 |
More Fuel

Turning Fleet Payment Data into Executive Insights
Ramel Lindsay of U.S. Bank Voyager discusses how fleets can transform payment and transaction data into actionable intelligence to reduce costs, improve oversight, and support executive decision-making.
Read More →
Why the IRS Raised Its Mileage Rate in the Middle of 2026
Fuel-price volatility drove the rare increase to 76 cents per mile, the fifth midyear adjustment since 2000.
Read More →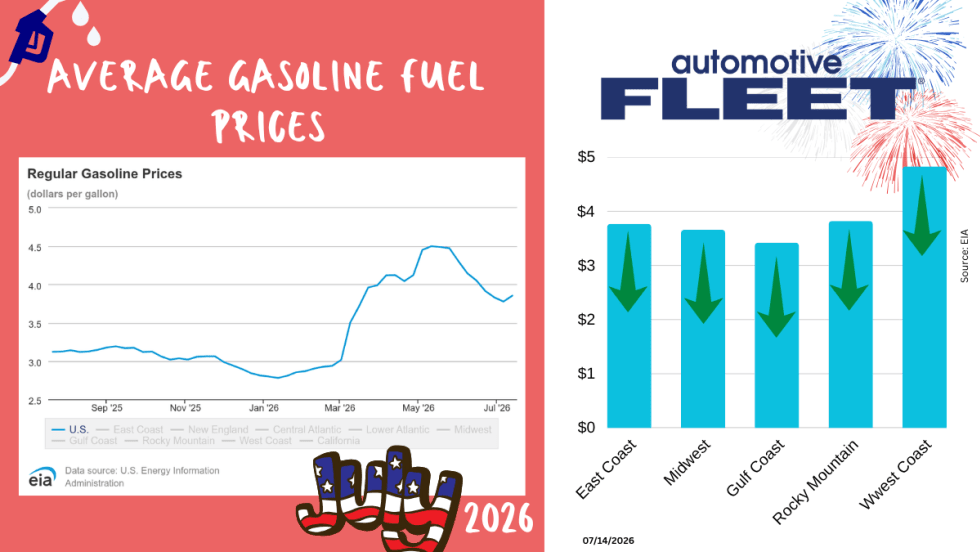
July Fuel Update: Prices Jump for the First Time in Two Months
As the U.S.-Iran ceasefire collapses, so do the gas prices.
Read More →
Bob Adamsky on Fuel Volatility: "Don't Panic, Have a Plan."
When it comes to up and down fuel prices, Adamsky has a message for fleets: “Don’t panic.”
Read More →
How Fleets Can Gain Control of Non-Fuel Spend
Fuel often gets the spotlight, but non-fuel expenses can have a major impact on fleet costs. Ramel Lindsay of U.S. Bank Voyager discusses how fleets can gain better visibility and control over these often-overlooked expenditures.
Read More →
Fuel is Just the Start: How Middle East Tensions are Driving Up Fleet Maintenance Costs
The Middle East conflict is doing more than pushing up fuel prices. It’s also raising the cost of key maintenance products your fleet depends on, from motor oil to tires to windshield wipers. Here’s what you need to know about this budget-busting situation.
Read More →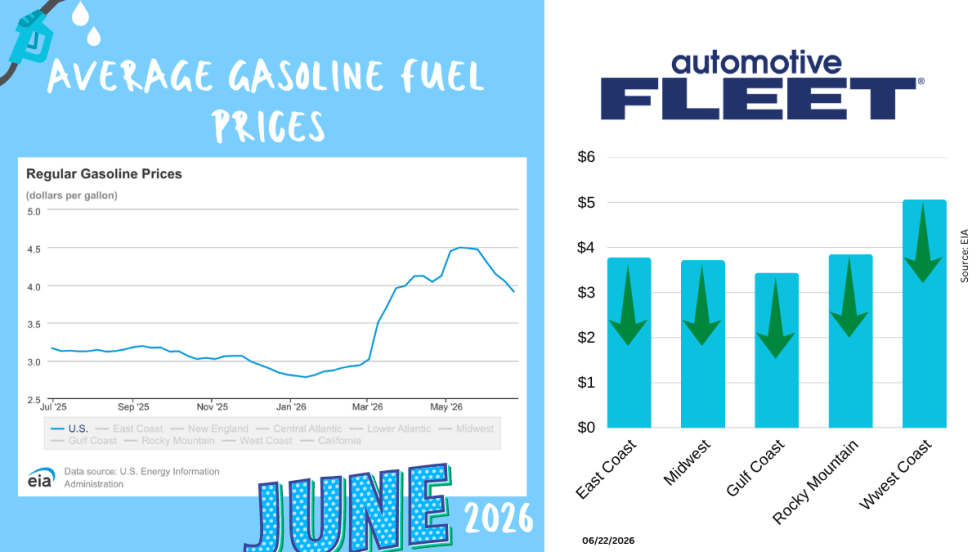
June Fuel Update: Prices Fall Below $4
Drivers are finally getting some relief at the pump. The national average gas price has dropped below $4 a gallon for the first time in months, with prices falling in 47 states as oil markets react to developments in U.S.-Iran negotiations.
Read More →
Study: How 2026's Gas Price Hikes Affect Different Vehicle Types
New data from iSeeCars reveals how rising fuel costs have affected different vehicle segments as gasoline prices climbed nearly 46% over the past four months.
Read More →Sponsored•May 29, 2026
Are You Tracking Your Fleet's True Total Cost of Ownership?
Bobit Business Media surveyed 190 fleet professionals and found that while most fleets are tracking costs, fragmented systems and data gaps are keeping true TCO visibility out of reach. With rising pressure to control spend in an increasingly volatile environment, the gap between what fleets think they know and what the data actually shows is wider than you might expect. See how your peers are managing costs today and where the industry still has room to improve.
Read More →
May Fuel Update: All Regions Experience Declines
Gas prices are finally easing in much of the country, but experts warn global tensions could quickly reverse the trend as the national average remains well above last month’s levels.
Read More →