




Study: How 2026's Gas Price Hikes Affect Different Vehicle Types
New data from iSeeCars reveals how rising fuel costs have affected different vehicle segments as gasoline prices climbed nearly 46% over the past four months.

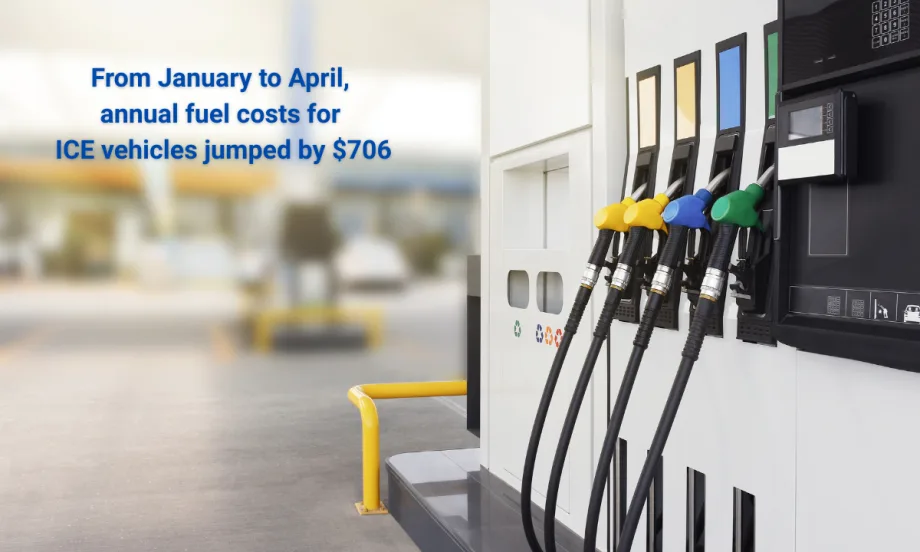
Annual fuel costs for internal combustion engine vehicles jumped an average of $706 over January to April, rising from $1,533 to $2,240.
Gasoline prices rose nearly 46% between January and April 2026, with fleet operators running larger conventional vehicles feeling a greater burden. An iSeeCars analysis of over 2.1m vehicles charted the cost spikes by vehicle types and models.
EVs and ICE Vehicles: A $695 Annual Fuel Cost Gap
According to iSeeCars’ analysis, annual fuel costs for internal combustion engine vehicles jumped an average of $706 over that four-month period, rising from $1,533 to $2,240. Electric vehicles, by contrast, saw annual energy costs increase just $11, from $714 to $725.
"Everyone knows fuel prices are up, but we wanted to evaluate the impact of rising energy costs on each of the major drivetrain categories," said iSeeCars Executive Analyst Karl Brauer in an announcement.
"You'd expect EV drivers to be largely shielded from the rise in fuel prices, and their $11 increase in annual fuel costs versus $706 for gasoline vehicles confirms it."
Hybrids Offer a Middle Ground
Conventional hybrids — which logged the most annual miles of any drivetrain category at nearly 14,700 miles per year — saw fuel costs rise $486, meaningfully less than their ICE counterparts.
Plug-in hybrids fared even better, absorbing a $291 increase, with models like the Toyota Prius Prime and Hyundai Ioniq PHEV among the least-affected gas-consuming vehicles in the study.
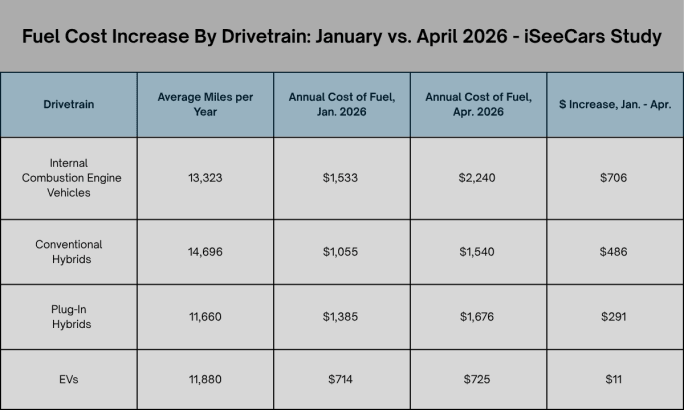
Conventional gasoline vehicles saw annual fuel costs rise by more than $700 on average since January, compared to just $11 for EVs.
Trucks, Minivans, and Large SUVs Absorb the Biggest Increases
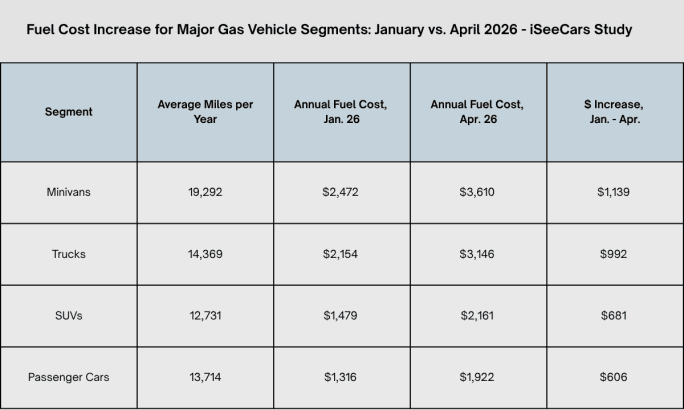
Among conventional vehicle segments, the pain was, not surprisingly, concentrated at the larger, less fuel-efficient end of the spectrum. Minivans saw the steepest annual fuel cost increase at $1,139 — driven in large part by the segment's high average mileage of 19,292 miles per year, nearly 5,000 more than the next-highest segment.
Trucks weren't far behind, absorbing a $992 increase despite lower average annual mileage, due to their relatively poor fuel economy. SUVs rose $681, while passenger cars saw the smallest increase among ICE segments at $606.
The Hardest-Hit Models: Large SUVs Dominate
At the individual model level, the vehicles with the largest increases in fuel cost are dominated by full-size, three-row SUVs. The Toyota Sequoia topped the list, with estimated annual fuel costs rising from $3,523 in January to $5,145 in April — a jump of $1,623.
The Chevrolet Suburban ($1,542) and Nissan Armada ($1,513) rounded out the top three, followed closely by the GMC Yukon XL and Chevrolet Tahoe.
"Large, three-row SUVs can accomplish nearly any task related to personal transportation," said Brauer. "Unfortunately, the high functionality of large SUVs combines with their less-than-stellar fuel efficiency to make their annual operating costs extremely volatile when fuel prices spike."
Visit here for more details on the study and methodology.
More Fuel
Fuel Prices Surge in September | September Fuel Update
September brought major fuel price swings, including diesel crossing $6 a gallon. Here’s how gas and diesel prices changed throughout the month, and where they stood heading into October.
Read More →
Turning Fleet Payment Data into Executive Insights
Ramel Lindsay of U.S. Bank Voyager discusses how fleets can transform payment and transaction data into actionable intelligence to reduce costs, improve oversight, and support executive decision-making.
Read More →
Why the IRS Raised Its Mileage Rate in the Middle of 2026
Fuel-price volatility drove the rare increase to 76 cents per mile, the fifth midyear adjustment since 2000.
Read More →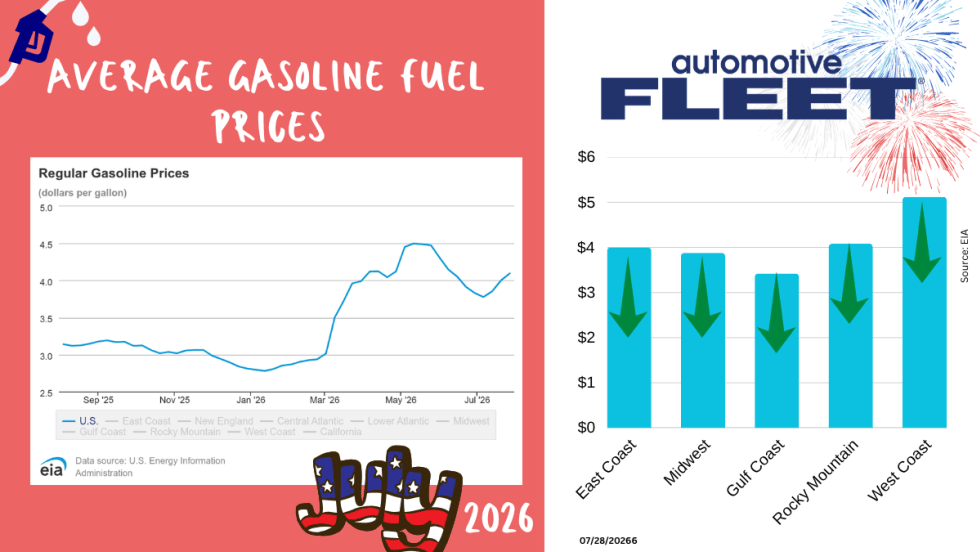
July Fuel Update: Prices Keep Rising in Light of More Conflict
Gas prices continue to rise as more and more conflicts do, too.
Read More →
Bob Adamsky on Fuel Volatility: "Don't Panic, Have a Plan."
When it comes to up and down fuel prices, Adamsky has a message for fleets: “Don’t panic.”
Read More →
How Fleets Can Gain Control of Non-Fuel Spend
Fuel often gets the spotlight, but non-fuel expenses can have a major impact on fleet costs. Ramel Lindsay of U.S. Bank Voyager discusses how fleets can gain better visibility and control over these often-overlooked expenditures.
Read More →
Fuel is Just the Start: How Middle East Tensions are Driving Up Fleet Maintenance Costs
The Middle East conflict is doing more than pushing up fuel prices. It’s also raising the cost of key maintenance products your fleet depends on, from motor oil to tires to windshield wipers. Here’s what you need to know about this budget-busting situation.
Read More →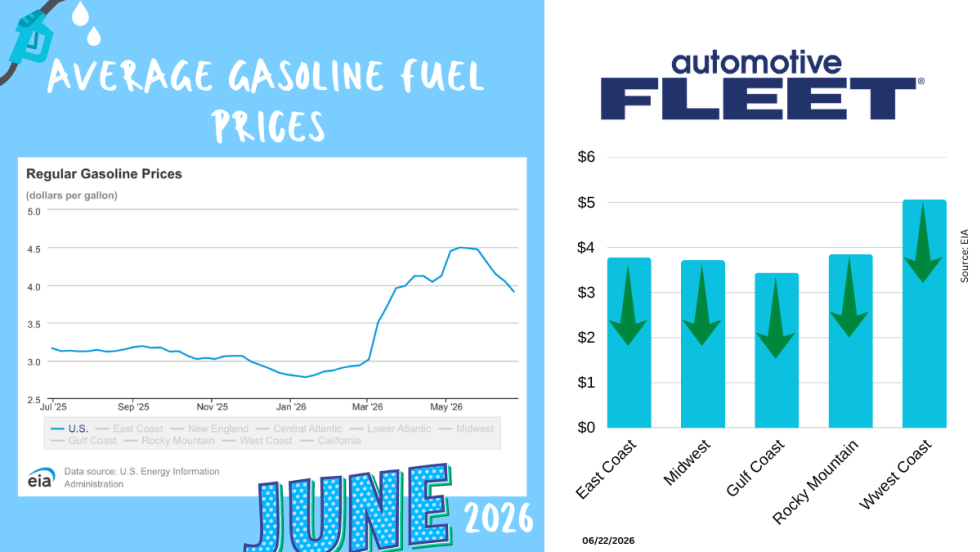
June Fuel Update: Prices Fall Below $4
Drivers are finally getting some relief at the pump. The national average gas price has dropped below $4 a gallon for the first time in months, with prices falling in 47 states as oil markets react to developments in U.S.-Iran negotiations.
Read More →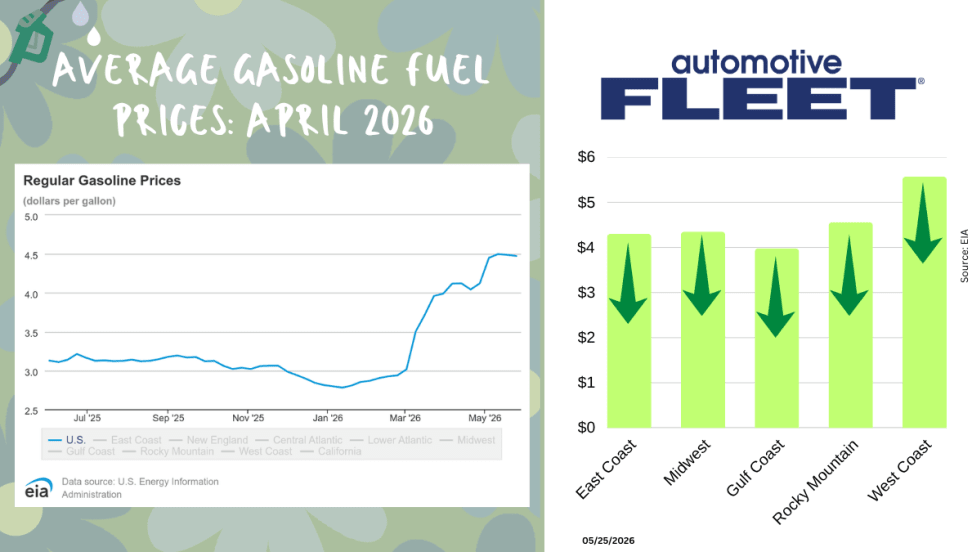
May Fuel Update: All Regions Experience Declines
Gas prices are finally easing in much of the country, but experts warn global tensions could quickly reverse the trend as the national average remains well above last month’s levels.
Read More →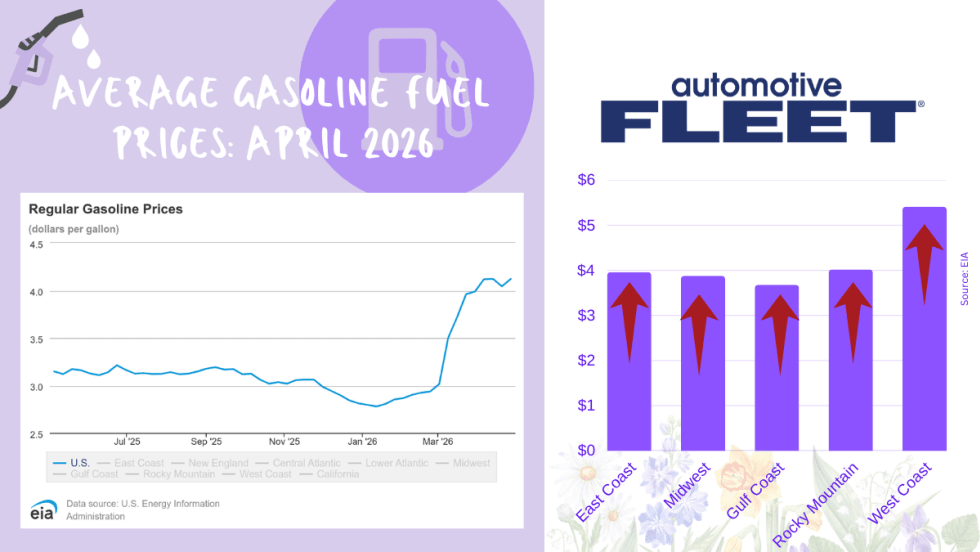
April Fuel Update: Prices Climb Above $4 as Spring Surge Accelerates
National average jumps to $4.04 per gallon, up sharply from last year, with West Coast prices topping $5 and further increases expected amid rising oil tensions.
Read More →