

Personal Use Charges Hit $116 in 2012
Overall, personal use charges stayed flat in 2012 versus 2011; however, fewer fleets are allowing personal use of company-provided vehicles and many are structuring policies to push more fuel-efficient vehicle selections.

Average personal use charges decreased slightly in 2012 to $116 per month, compared to $118 per month in 2011. Automotive Fleet’s annual survey of personal use charges and policies took place via an online questionnaire, completed by fleet managers across all industries.
One reason for the decrease in charges may have to do with fleet composition.
“We have reduced the personal-use charge for drivers who choose four-cylinder vehicles, which has helped increase the number of four-cylinder units in our fleet,” commented one fleet manager, who wished to remain anonymous.
The total percentage of fleets allowing personal use of company-provided vehicles also decreased in 2012 (85 percent), down 4 percentage points from 2011 (89 percent).
“We implemented a new driver contribution just in 2011,” said Carol Davies, fleet manager for Advanced Auto Parts. “Our personal use is increasing, which ultimately increases our costs, so the current collected amount may have to be modified since it was based on our costs. The drivers’ thought was, ‘If I’m being charged now, then I’m going to run the heck out of it.’ ”
Fleet managers noted additional vehicle categories popping up on selector lists for the 2013 model-year, including the ongoing trend to crossovers, which originated back in the late 1980s and became a stronger trend in the early 2000s.
“We will probably be adding the crossover category for MY-2013 with the full-size and compact choices, but will increase the personal use fee for the crossover to $195 per month,” noted a fleet manager who wished to remain anonymous. “However, for MY-2014, we will remove the full-size car model and only offer the crossover and compact car (at $140 per month). This will allow an increased personal use fee, and provide a comparable total cost of ownership (TCO) to the company.”
Coping with Non-Employee Drivers
How fleets handle non-employees driving company vehicles has also changed over the past year. In 2011, 63 percent of fleets performed a motor vehicle record (MVR) check on non-employees driving company-provided vehicles. That number dropped to 55 percent in 2012.
However, the number of non-employees allowed use of company vehicles is increasing, with 64 percent allowing spouses to drive company-provided vehicles, 10 percent allowing licensed children, and 30 percent allowing other drivers, including domestic partners, household members over the age of 21, or licensed family members over the age of 25.
More fleets are allowing non-employees to drive company-provided vehicles, with only 30 percent restricting personal use to the employee only in 2012, down 5 percentage points from 2011 (35 percent).
Digging Deeper into the Numbers
The majority of fleets (71 percent in 2012) that allow personal use of company-provided vehicles allow use at all times, whenever necessary. This is a slight decrease over 2011 numbers (76 percent), but still higher than what was seen in 2010 (66 percent). This was followed by “other” at 13 percent, including within only 150-mile radius of home, at all times except vacations. Third was within 75 miles of a garaged location and only to and from work, at 11 percent.
Governing the use of company-provided vehicles is typically job function (for 73 percent of survey participants), which is up 2 percentage points over 2011. Job title (50 percent) and annual business miles driven (48 percent) follow as the second and third most popular ways to determine personal-use eligibility requirements.
Of fleets that allow personal use of company-provided vehicles, only 64 percent charge directly for use, down from 78 percent in 2011.
Fleets use several different methods to determine personal-use charges, with the most popular in 2012 using industry averages or competitive benchmarks at 21 percent. This is followed by other methods (19 percent) including standard deductions, determining annual lease value (ALV) of fleet, and others. Calculating the cost to the company (18 percent) came in third.
Fleets are also working to simplify the reporting process for fleet drivers.
"We simplified our process. Instead of sending our reports semiannually to drivers, we now do it annually and only offer one option which is per round trip charge,” said Vicki Driessen, fleet manager for Faith Technologies.
Previously, the company allowed each driver to select either the long-form version, which was using the annual lease value, or round-trip version.
“We did this to cut costs and receive the reports back from drivers much quicker. We now e-mail about 75 percent of them to drivers instead of 100-percent mail version, which also cut our costs. Drivers now respond via e-mail (much quicker responses from drivers).”
Most fleets (67 percent) perform a personal-use reconciliation, or “true-up,” every year. While 22 percent of fleets reported that they never perform a reconciliation, 10 percent performed one on a more frequent basis, including biannually, every pay period, quarterly, and monthly.
The percentage of fleets that directly charge employees a portion of repair costs for an accident occurring during personal use remained on par in 2012, at 76 percent (compared to 78 percent in 2011).
While the overall average personal use charge for 2012 was $116, when looking at charge ranges, most fleets (33 percent) charge between $100 and $149 per month for personal use of a company-provided vehicle. Many fleets are creating vehicle categories to urge employees to use more fuel-efficient vehicles and provide additional, lower-cost options.
“We created categories of vehicles to allow choice. The least expensive personal use per month is for the category we most desire our drivers to select,” said Sue Miller, manager, fleet program services for McDonald’s Corp. “This category provides the optimum TCO on our selector.”
The majority of fleets (89 percent) utilize a payroll deduction for personal-use charges, up 2 percentage points from 2011.
Finally, when fleets are reimbursed for business use of a company-provided vehicle, the majority of fleets (86 percent in 2012) utilize a per-mile rate, down from the 90 percent reported in 2011, followed by a combined per mile/flat rate (6 percent).
More Fuel

Turning Fleet Payment Data into Executive Insights
Ramel Lindsay of U.S. Bank Voyager discusses how fleets can transform payment and transaction data into actionable intelligence to reduce costs, improve oversight, and support executive decision-making.
Read More →
Why the IRS Raised Its Mileage Rate in the Middle of 2026
Fuel-price volatility drove the rare increase to 76 cents per mile, the fifth midyear adjustment since 2000.
Read More →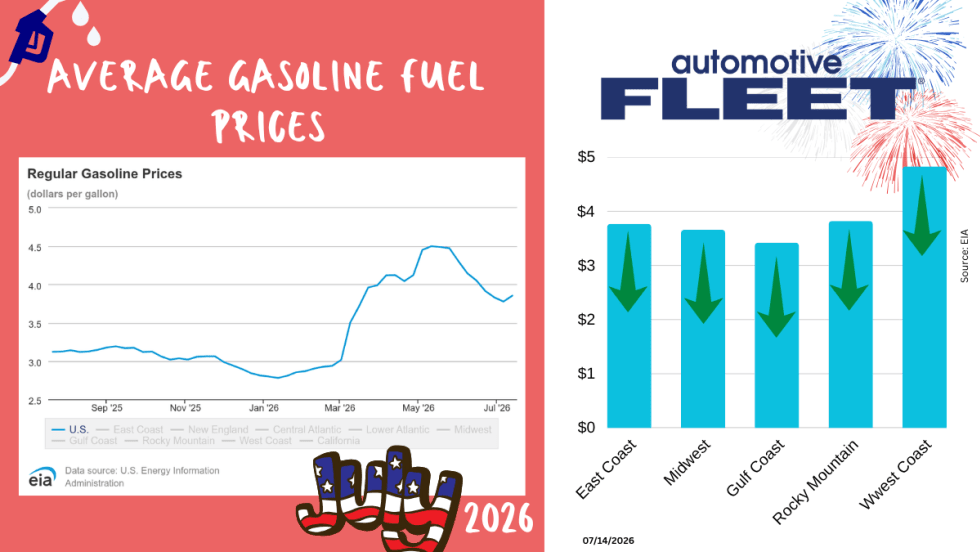
July Fuel Update: Prices Jump for the First Time in Two Months
As the U.S.-Iran ceasefire collapses, so do the gas prices.
Read More →
Bob Adamsky on Fuel Volatility: "Don't Panic, Have a Plan."
When it comes to up and down fuel prices, Adamsky has a message for fleets: “Don’t panic.”
Read More →
How Fleets Can Gain Control of Non-Fuel Spend
Fuel often gets the spotlight, but non-fuel expenses can have a major impact on fleet costs. Ramel Lindsay of U.S. Bank Voyager discusses how fleets can gain better visibility and control over these often-overlooked expenditures.
Read More →
Fuel is Just the Start: How Middle East Tensions are Driving Up Fleet Maintenance Costs
The Middle East conflict is doing more than pushing up fuel prices. It’s also raising the cost of key maintenance products your fleet depends on, from motor oil to tires to windshield wipers. Here’s what you need to know about this budget-busting situation.
Read More →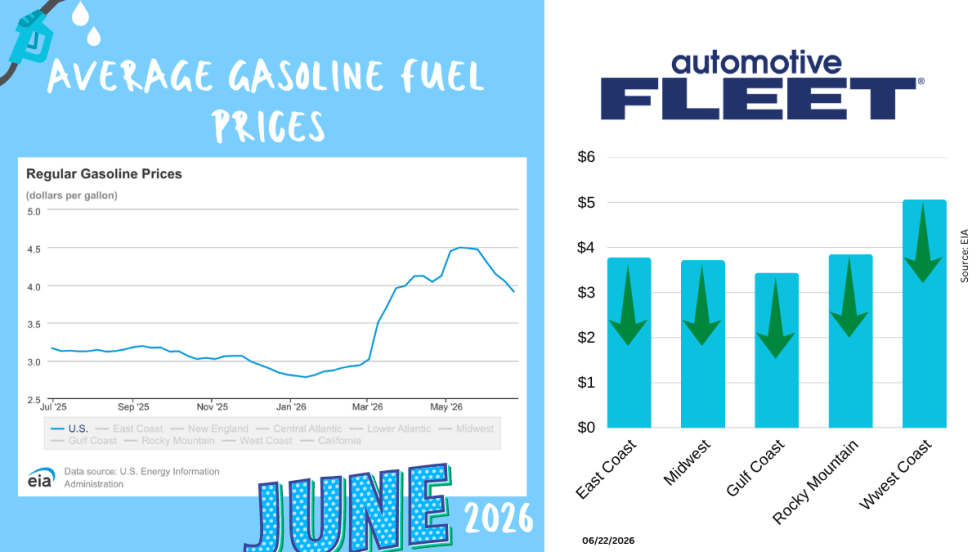
June Fuel Update: Prices Fall Below $4
Drivers are finally getting some relief at the pump. The national average gas price has dropped below $4 a gallon for the first time in months, with prices falling in 47 states as oil markets react to developments in U.S.-Iran negotiations.
Read More →
Study: How 2026's Gas Price Hikes Affect Different Vehicle Types
New data from iSeeCars reveals how rising fuel costs have affected different vehicle segments as gasoline prices climbed nearly 46% over the past four months.
Read More →Are You Tracking Your Fleet's True Total Cost of Ownership?
Bobit Business Media surveyed 190 fleet professionals and found that while most fleets are tracking costs, fragmented systems and data gaps are keeping true TCO visibility out of reach. With rising pressure to control spend in an increasingly volatile environment, the gap between what fleets think they know and what the data actually shows is wider than you might expect. See how your peers are managing costs today and where the industry still has room to improve.
Read More →
May Fuel Update: All Regions Experience Declines
Gas prices are finally easing in much of the country, but experts warn global tensions could quickly reverse the trend as the national average remains well above last month’s levels.
Read More →