

Wholesale Used-Vehicle Prices Fall Slightly in July
All major market vehicle segments saw price declines year over year and all were down compared to the previous months, except for one.

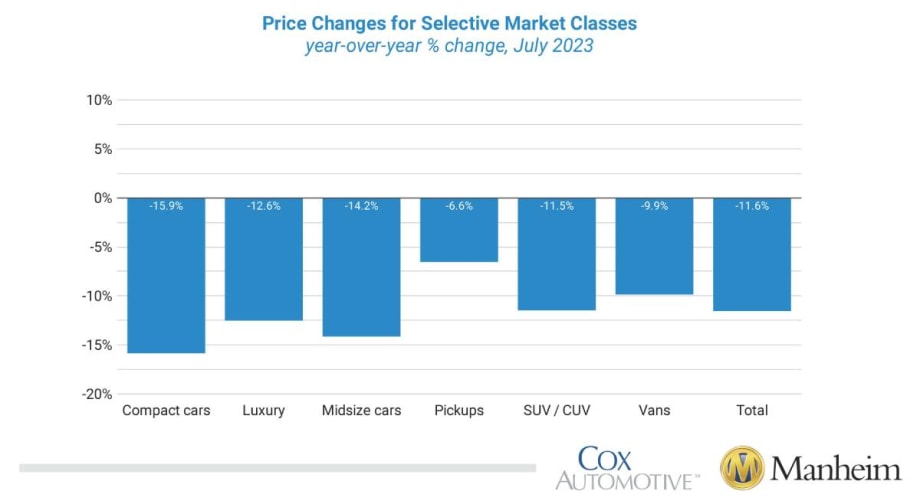
Compared to July 2022, pickups and vans again lost less than the industry, down 6.6% and 9.9%, respectively. SUVs fared only minimally better than the industry, off 11.5%.
Graphic: Cox Automotive/ Manheim
Wholesale used-vehicle prices (on a mix, mileage, and seasonally adjusted basis) decreased 1.6% in July from June, accordin to the Manheim Used Vehicle Value Index (MUVVI) released Aug. 7. The index declined to 211.7, down 11.6% from a year ago.
“The July drop of 1.6% is an indicator of slowing wholesale price declines, at least when compared to the month-over-month losses we’ve seen since April,” said Chris Frey, senior manager of economic and industry insights for Cox Automotive, in a news release. “From July 2020, there were 22 straight monthly double-digit increases through April 2022; we’ve had just six double-digit declines since October last year, with only four of them consecutive. Keeping to the April theme, we’re now back to the same index value last seen in April 2021: 211.7. Used retail inventory continues to rebuild; but with used retail sales also showing some summer strength, we do not foresee wholesale price declines of serious import through December.”
July’s decrease was softened by the seasonal adjustment. The non-adjusted price change in July decreased by 3.8% compared to June, moving the unadjusted average price down 10.7% year over year.
In July, Manheim Market Report (MMR) values saw above-average declines that slowed as the month ended. Over the last four weeks, the Three-Year-Old Index declined an aggregate 3.4%.
In July, daily MMR Retention, which is the average difference in price relative to the current MMR, averaged 98.6%, meaning market prices were below MMR values. The average daily sales conversion rate declined to 48.9%, which was below normal for the time of year.
For context, the daily sales conversion rate averaged 60.1% in July 2019. Conditions favored buyers all month, but supply remained limited. The sales conversion rate in July was higher than in July 2022, which saw a 46.4% rate.
The major market segments saw seasonally adjusted prices that continued lower year-over-year in July. Compared to July 2022, pickups and vans again lost less than the industry, down 6.6% and 9.9%, respectively. SUVs fared only minimally better than the industry, off 11.5%. Compact cars performed the worst year over year, down 15.9%, followed by midsize cars at 14.2%, luxury at 12.6%, and sports cars at 12.1%.
Compared to last month, all segments were down except one, with sports cars being up by 1.6%. Pickups lost less than the industry month over month, down 0.6%, while vans, compact cars, and luxury lost the most, with declines of 3.2%, 2.8%, and 2.4%, respectively.
Used Retail Vehicle Sales Increased in July
Assessing retail vehicle sales based on observed changes in advertised units tracked by vAuto, Cox initially estimates that used-vehicle retail sales in July were up 6% compared to June and saw the year-over-year comparison with 2022 improve.
Used retail sales are estimated to be down only 0.5% year over year in July, which was the best performance since February. The average retail listing price for a used vehicle moved 1.8% lower over the last four weeks.
Using estimates of used retail days’ supply based on vAuto data, an initial assessment indicates July ended at 46 days’ supply, down three days from 49 days at the end of June but eight days lower than how July 2022 ended at 54 days.
Leveraging Manheim sales and inventory data, wholesale supply is estimated to have finished July at 27 days, up one day from the end of June and down three days from July 2022’s estimate of 30 days.
June’s total new-light-vehicle sales were up 15.3% year over year, with one less selling day versus July 2022. By volume, July new-vehicle sales were down 5.1% month over month. The July sales pace, or seasonally adjusted annual rate (SAAR), came in at 15.7 million, an increase of 18.2% from last year’s 13.3 million and unchanged from June’s slightly revised 15.7 million pace.
Combined sales into large rental, commercial, and government fleets increased 35% year over year in July.
Sales into rental fleets were up 78% year over year, sales into commercial fleets were up 7.5%, and sales into government fleets were up 27%. Including an estimate for fleet deliveries into dealer and manufacturer channels, the remaining retail sales were estimated to be up 12.8%, leading to an estimated retail SAAR of 13.2 million, up from last year’s 11.4 million pace and up 0.4 million from last month’s 12.8 million pace.
The fleet market share was estimated to be 16%, a gain of 2.2% over last year’s share and down from June’s 17.4% market share.
Rental Risk Prices Decreased Substantially in July
Prices were off by 5.9% compared to June. Average mileage for rental risk units in July (at 60,500 miles) was up 2.9% compared to a year ago and up 6.7% from June.
Measures of Consumer Confidence Improved Again in July
The Conference Board Consumer Confidence Index increased by 6.3% in July, as views of both the present situation and future expectations improved. Consumer confidence was up 22.8% year over year. Plans to purchase a vehicle in the next six months increased to the highest level in nine months and were up year over year.
The confidence index did not fall as much during the pandemic as the sentiment index from the University of Michigan. Still, both series improved in June and July and were up substantially year over year against the peak of the inflation surge in 2022. The Michigan index increased 11.2% for the month and was up 39% year over year.
Consumers’ views of buying conditions for vehicles rose again in July to the best level since February.
The daily index of consumer sentiment from Morning Consult also measured improving sentiment in July, as the index posted a 2.8% gain over June. Expectations of the future improved the most in June and July and are at the highest level since August 2021.
A key worry for the two-month streak’s continuing is the increase in gas prices that accelerated at the end of July.
The national average price for unleaded gas increased 6.8% in July to $3.78 per gallon, which was down 10% year over year, according to AAA. The average gas price had been down 27% year over year to start the month.
More Remarketing
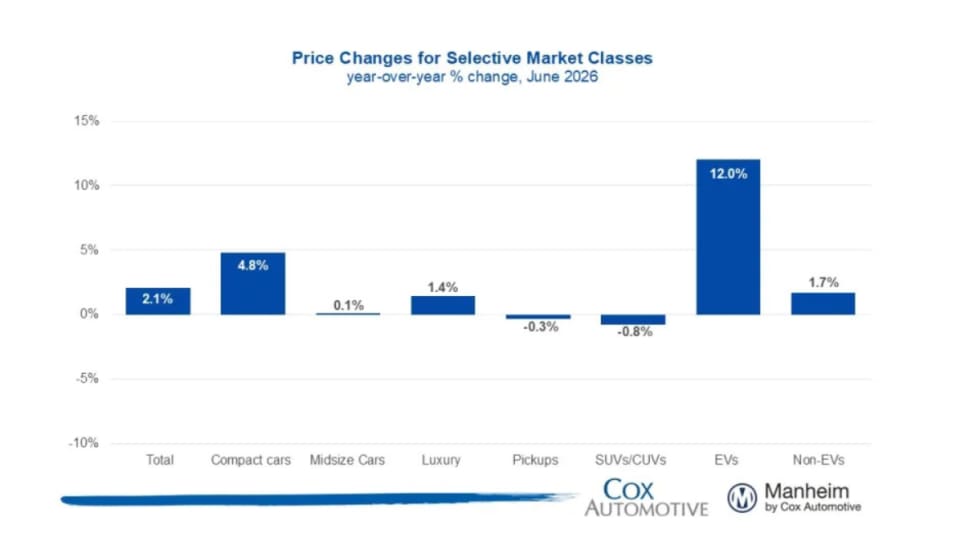
Manheim Index Shows Used-Vehicle Wholesale Prices Up 2.1% in June
The market is seeing stronger appreciation in older used vehicles this year, and the most affordable segments have been among the year’s best performers.
Read More →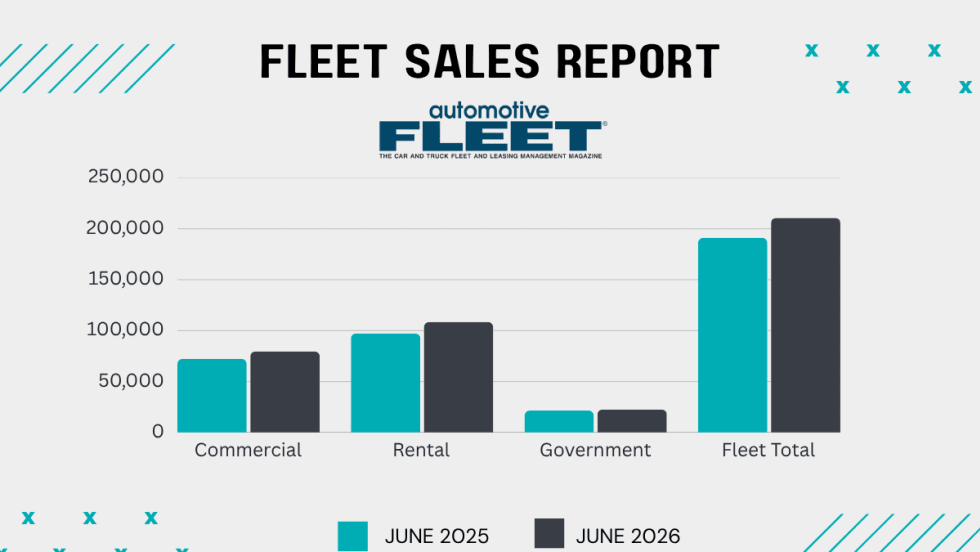
Commercial Fleet Sales Contribute To June, YTD Gains
The fleet sector has boosted its vehicle purchases at a reliable pace in the first half of this year compared with 1H 2025.
Read More →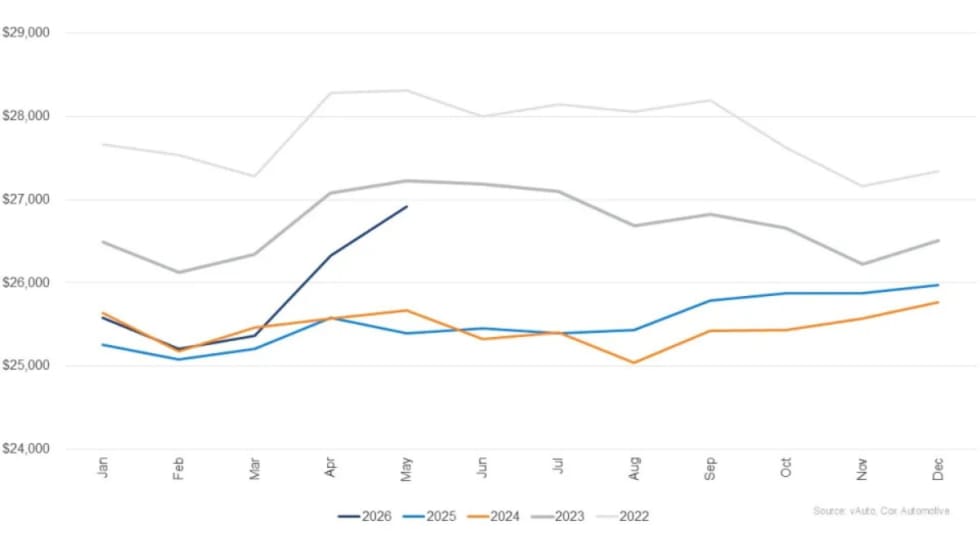
Used Vehicle Prices Climb Higher As Sales Pace Slows
The higher prices at used retail reflect strong wholesale values earlier in the spring, particularly for older, more affordable vehicles.
Read More →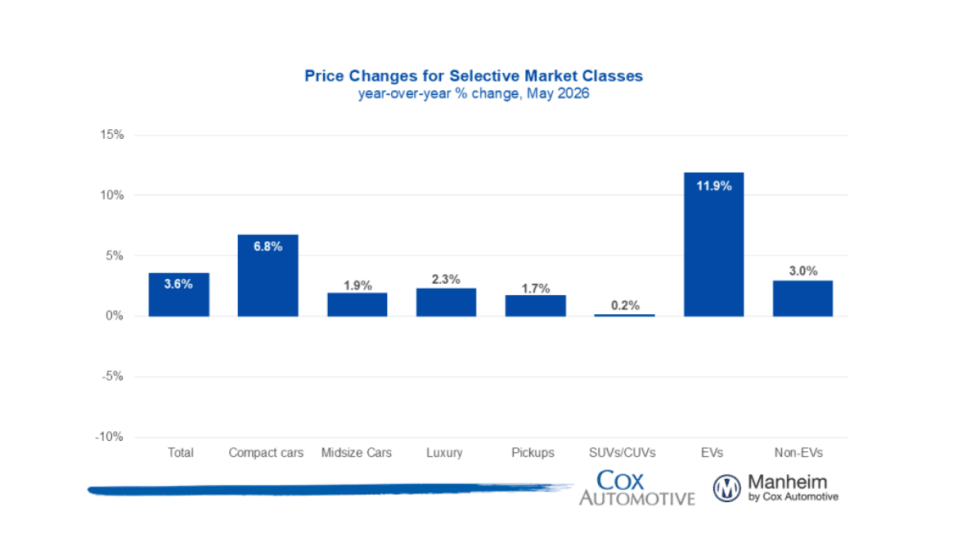
Wholesale Used Vehicle Market Sustains Moderate Rise In Values, Prices
Trends continue to normalize after a strong start to the year, as consumers contend with higher gas prices in the coming summer months.
Read More →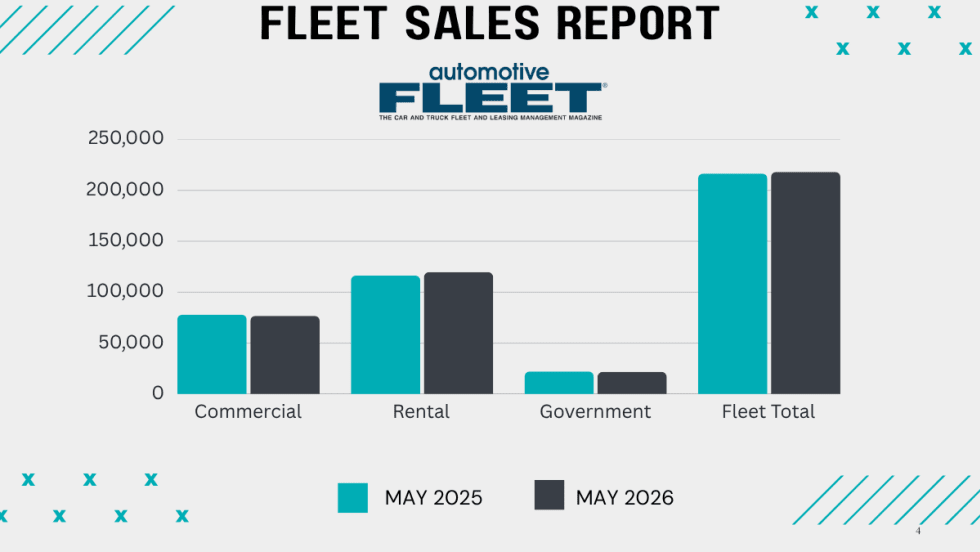
Commercial Fleet Sales Still Lead Sectors Despite May Mini Dip
The U.S. economy's continued growth and positive business investment are creating a favorable environment for fleet vehicle demand.
Read More →
How Connected Vehicle Data Is Lifting Fleet Resale Values
A vehicle health score could improve the value of fleet vehicles at remarketing. The path to a universal standard is forming, and fleets that understand the process early will be better positioned when it arrives.
Read More →
Wholesale Used Vehicle Prices Slightly Up In April
The Iranian conflict and rising gas prices inject much uncertainty into the future wholesale used vehicle markets, as higher gas prices soak up spendable income from vehicle buyers.
Read More →
CAR2026: James McKinley Wins Value Champion of the Year
James McKinley of City Rent a Truck was named the inaugural Fleet Value Champion at the CAR Conference for his data-driven approach to fleet lifecycle management and vehicle remarketing.
Read More →
CAR2026: Eric Autenrieth Wins Remarketer of the Year
Eric Autenrieth was recognized at this year's CAR Conference as the Remarketer of the Year.
Read More →
CAR2026: Lawrence Knapp Wins Consignor of the Year
Lawrence Knapp won the Cosigner of the Year award at this year's CAR Conference.
Read More →