Automotive Fleet
MenuMENU
SearchSEARCH
Enter keywords to search across all content
Graphic showing U.S. gas prices April 2026 with line chart near $4.04 per gallon and regional bars: West Coast highest at $5.41, others around $3.68–$4.02, indicating rising fuel costs.
Newsby Faith HowellApril 29, 2026

April Fuel Update: Prices Climb Above $4 as Spring Surge Accelerates

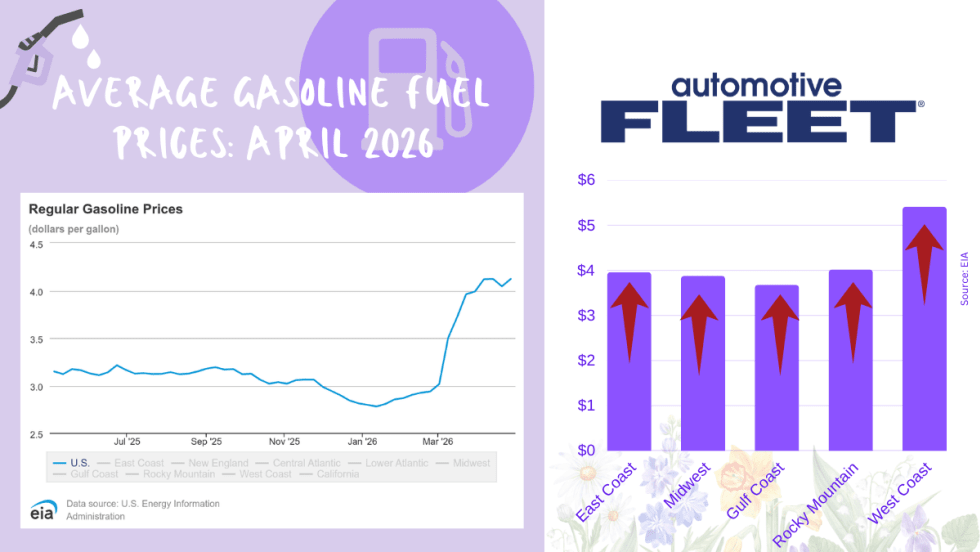
National average jumps to $4.04 per gallon, up sharply from last year, with West Coast prices topping $5 and further increases expected amid rising oil tensions.

Read More →
Graphic showing U.S. average gas prices for March 2026 with a line chart and regional breakdown, highlighting rising prices and highest costs on the West Coast above $5 per gallon.
Newsby Faith HowellMarch 31, 2026

March Fuel Update: Prices Settle With a $4 Average

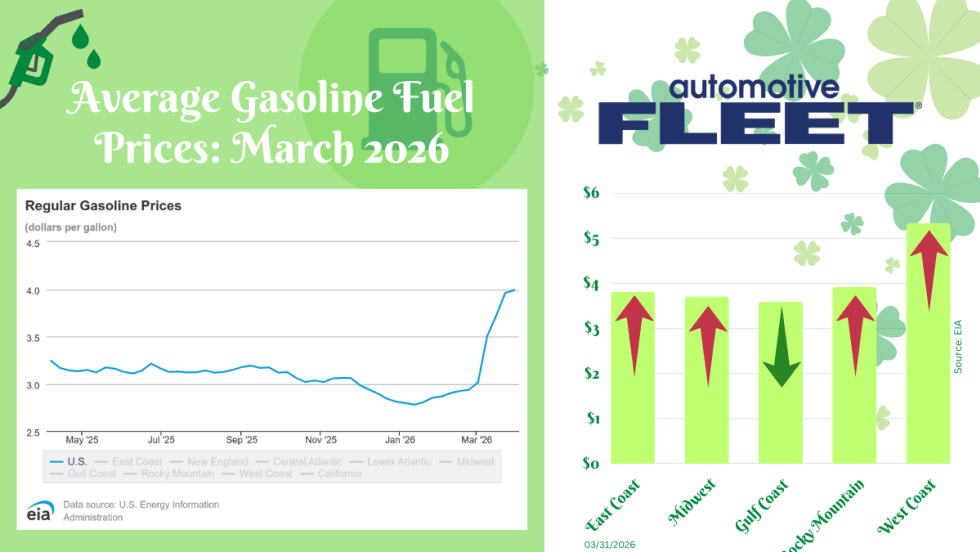
Fuel prices significantly slowed this week, but a $4 national average is still expected.

Read More →
Two men seated at a table during an interview about fleet fuel strategy, with on-screen text reading “AWP Safety Bob Adamski Senior Director of Fleet.”
Videosby Chris BrownMarch 20, 2026

Bob Adamsky on Fuel Volatility: “Don’t Panic — Have a Plan”

With oil prices rising again, AWP Safety’s fleet manager shares how to respond to rising fuel costs and how the right strategy can turn fuel spikes into cost-saving opportunities.

Read More →
Ad Loading...
A chart with EIA data shows an increase in U.S gas prices. Next to it, a chart breaks down the prices by region.
Newsby Faith HowellFebruary 25, 2026

February Fuel Update: Prices Inch Higher for Third Week in a Row

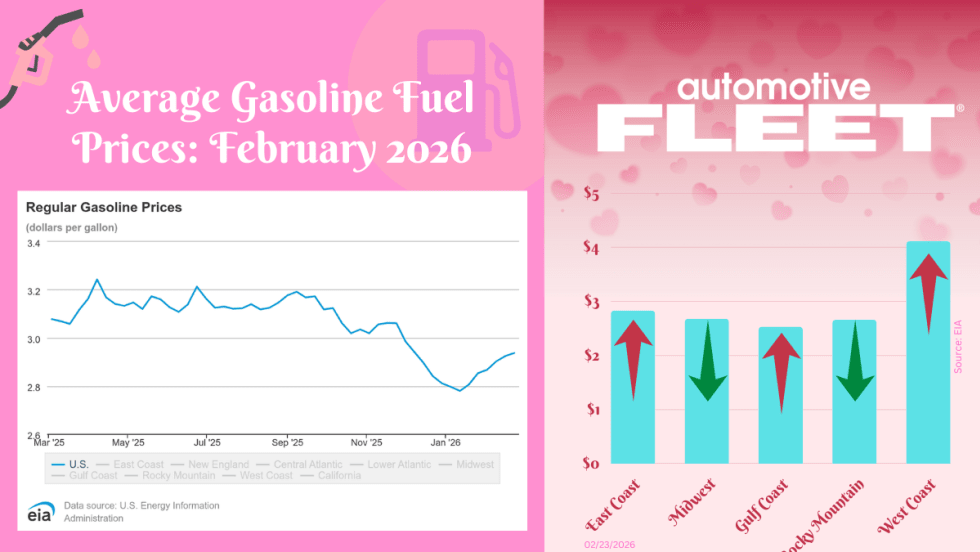
The final February fuel update reveals prices continuing to inch higher for the third week in a row.

Read More →
A chart with EIA data shows an increase in U.S gas prices. Next to it, a chart breaks down the prices by region.
Newsby Faith HowellJanuary 28, 2026

January Fuel Update: Prices Hit Highest Level Since Summer

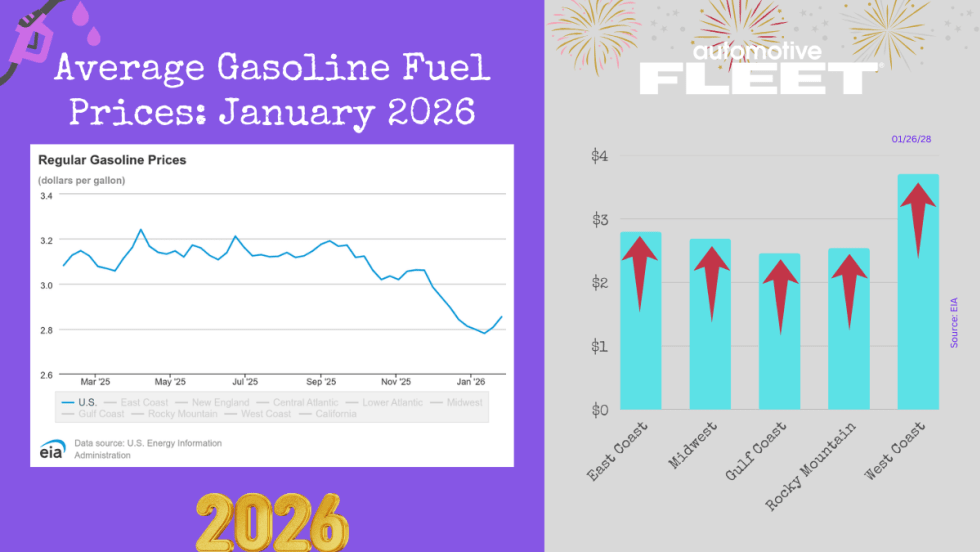
The national average for fuel prices has officially risen to its highest point since the summer.

Read More →
A chart with EIA data shows a decrease in U.S gas prices. Next to it, a chart breaks down the prices by region.
Newsby Faith HowellDecember 23, 2025

Christmas Comes Early at the Pump: Gas Averages $2.79 Nationwide

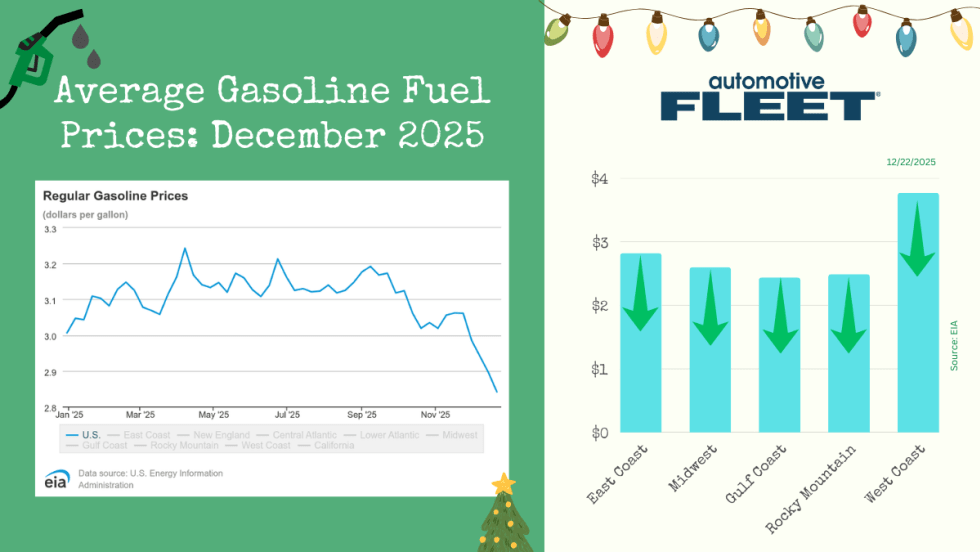
The nation's fuel price average continues to decline, with current Christmas numbers the lowest since 2020.

Read More →
Ad Loading...
AF News recap thumbnail.
Videosby Faith HowellDecember 5, 2025

Wait, Gas for $2? Plus, Leadership Insights on the Industry's Future | AF Weekly News

This week's AF news recap features declining fuel prices at the pump and industry insights from top leaders.

Read More →
A chart with EIA data shows an increase in U.S gas prices. Next to it, a chart breaks down the prices by region.
Newsby Faith HowellOctober 28, 2025

The Final October Fuel Update: Gas Prices Jump Again

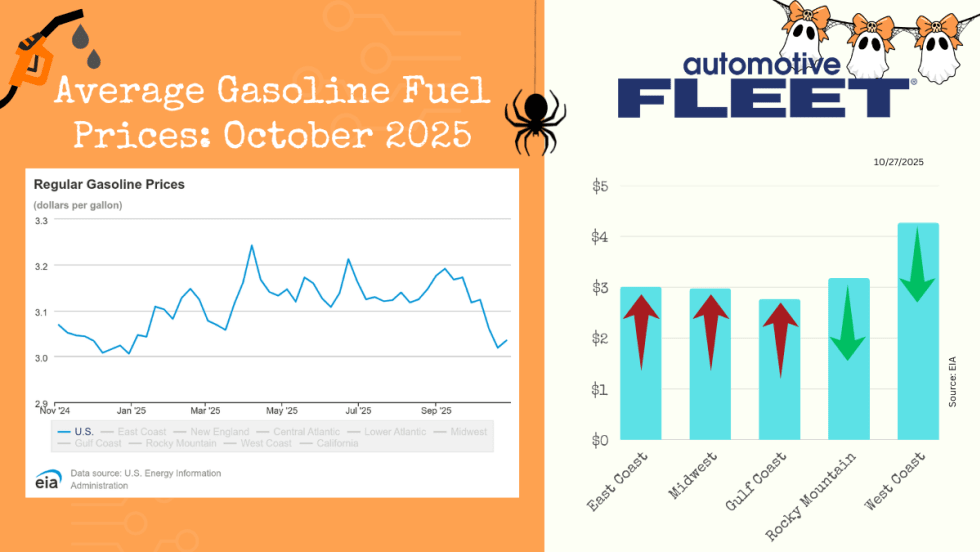
Rejoicing at the pumps was short-lived; fuel prices have risen above $3 once more.

Read More →
A red and blue graphic shows the average pricing for fuel during Labor Day weekend the last five years.
Newsby Faith HowellSeptember 1, 2025

Labor Day Fuel Update: Lowest National Average in Five Years

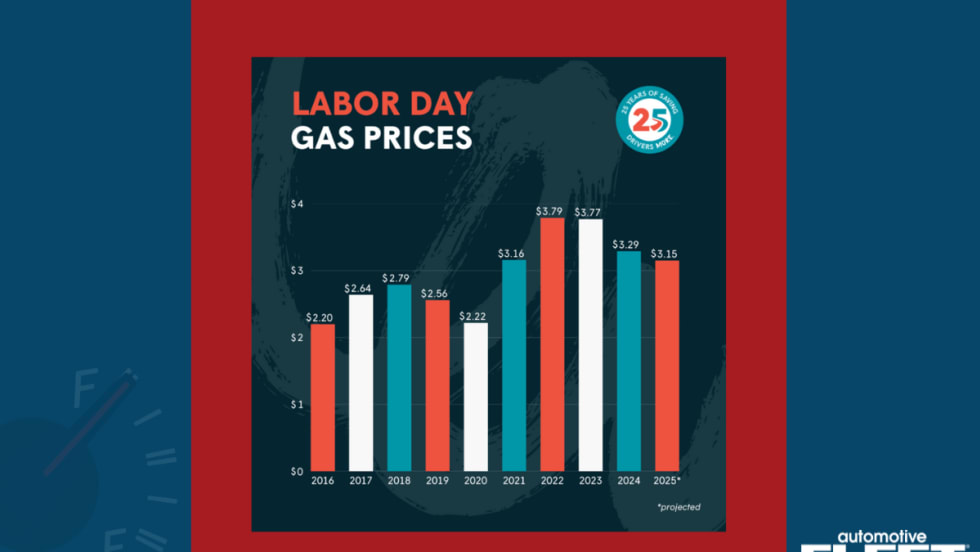
Labor Day gas prices hit their lowest point in five years, rounding out a record-low summer for fuel.

Read More →
Ad Loading...
A chart with EIA data shows a drop in U.S gas prices. Next to it, a chart breaks down the prices by region.
Newsby Faith HowellJuly 23, 2025

July 2025 Fuel Update: Prices Edge Up

Gas prices inch up in two different regions in light of Trump trade deal.

Read More →