





Read More: Speeding: Top Causes, Tough Consequences
Wyoming, Utah, and Virginia Have Most Speed-Related Crashes
A new state-by-state analysis examines the prevalence of fatal collisions where speed-related factors played a role.
September 18, 2023
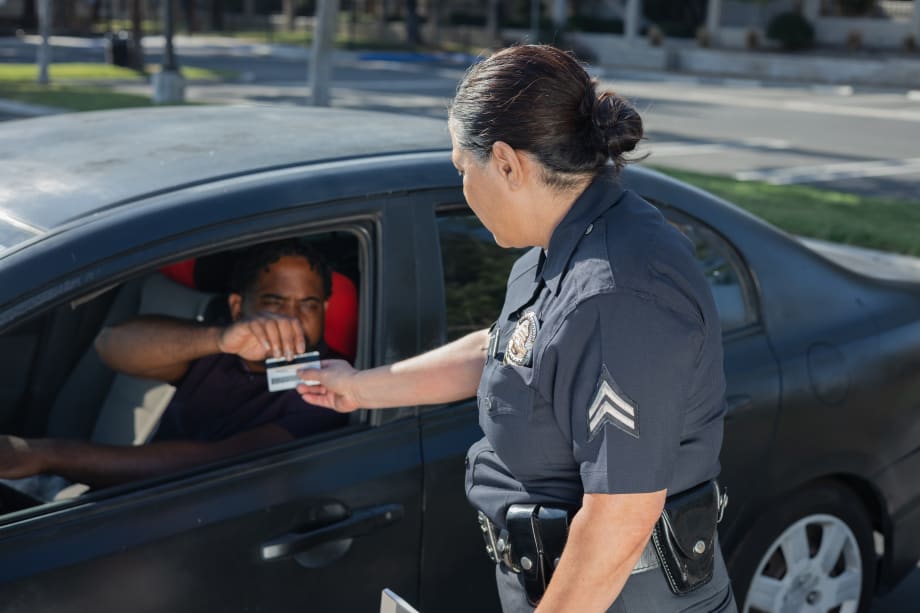
In 2021, speeding killed 12,330 people. Experts say enforcement of speed limit laws is critical to discouraging drivers from speeding.
Photo: pexels.com/Kindel Media
3 min to read
Wyoming leads the nation as the state with the highest proportion of fatal crashes — 28.43% -- where speed was a contributing factor, according to a new analysis from business litigation and personal injury lawyers, Heninger Garrison Davis.
Specifically, some 29 out of 102 recorded fatal collisions in Wyoming involved drivers traveling at inappropriate speeds. The alarming rate of 28.43% is approximately 64% higher than the national average, which stands at 17.35%.
The report, which is based on FARS 2021 data from the National Highway Traffic Safety Administration (NHTSA), examines fatal collisions where speed-related factors played a role. These include a driver exceeding the speed limit, driving too fast for the road conditions, or racing.
High speeds make a crash more likely because drivers have less time to react and because it requires a longer distance to stop or slow down. They also make collisions more deadly because modest increases in speed cause large increases in crash energy.
Utah had the second-highest rate of fatal crashes where speed was a contributing factor. In total 26.62%, or 78 out of 293, of all fatal crashes in Utah involved incorrect driver speeds. That translates to a rate 53.41% above the national average.
Ranking third among all states, Virginia had a rate of 26.49%. Some 240 of the 906 crashes that resulted in deaths in Virginia were recorded as having speed as a contributing factor. This rate is 52.65% above the national average.
Nearly 26% -- or 242 of the 931— fatal crashes in Missouri involved speed as a contributing factor, which places Missouri as fourth in America for speed-related fatal crashes. Missouri’s rate is 49.79% above the national average.
Ranking fifth is Connecticut with 24.38% or 69 of the 283 total fatal crashes involving speed — a rate 40.5% greater than the national average.
Other states that ranked among the top 10 for the highest proportion of fatal crashes linked to speed-related factors include Colorado (23.82%), Florida (22.52%), Delaware (21.97%), Mississippi (21.52%), and Texas (21.07%).
Identifying and Addressing Speed Problems
Over 12,000 deaths — 29% of all crash fatalities — occurred in speed-related crashes in 2021, according to the Insurance Institute for Highway Safety (IIHS).
Speeding has become both more common and more extreme since the start of the COVID-19 pandemic in 2020. Experts link the increase in risky driving behavior to frustration, anger, and open roads that were free of congestion during lockdown.
In 2021, NHTSA reported that the difference in speed between the fastest 1% of vehicles and the slowest 1% significantly narrowed on urban interstate freeways after March 2020 compared with 2019, from approximately 10 mph to less than 5 mph.
But it’s not only the pandemic that has had an impact on people choosing to speed. Speed limits across the nation have been climbing higher and higher in recent decades, to the detriment of safety, notes the IIHS.
For many people, it’s typical to drive faster than the speed limit, and if the limit is raised, they will go faster still. Research shows that when speed limits are raised, driver speeds go up, as do fatal crashes.
Strict enforcement of speed limit laws is imperative to discourage people from speeding.
The IIHS also endorses the use of speed safety cameras as a tool to curb speeders. Numerous studies have shown that cameras reduce speeds and crashes on all types of roads.
Speed safety cameras were in operation in 183 U.S. communities in 18 states and the District of Columbia during 2022, according to media sources and other public information tracked by IIHS, up from only four Arizona and Utah communities in 1995.
More Safety

Does Your Fleet's Culture Encourage Distracted Driving?
What happens when the people responsible for enforcing safety rules are the ones setting the wrong example? The answer may reveal why some of the biggest risks to fleet drivers have little to do with what's written in the employee handbook.
Read More →
Sponsored•October 1, 2026
Fleet Manager’s Ultimate Playbook: Navigating the New Standard in OEM Connectivity
Rising operating costs, driver safety concerns, and unplanned downtime are putting unprecedented pressure on modern fleets. Discover how fleet managers use embedded OEM connectivity and real-time vehicle data to cut TCO, prevent downtime, and protect drivers without aftermarket telematics hardware.
Read More →
From Driver Well-Being to EV Charging | AF News Recap
Mental health belongs in the fleet safety conversation. This week, we’re looking at five ways fleets can support employee well-being before a crisis, plus Holman’s expansion in Mexico, new one-day Fleet Forward passes, and why EV charging demand is outpacing infrastructure growth.
Read More →
Nexar-Nauto Merger Aims to Give Fleets Better Safety Intelligence Through Larger Driving Dataset
Stefan Heck tells Automotive Fleet that combining more than 10 billion miles of driving history with Nexar's AI models will give fleets deeper insights into driver risk and roadway conditions than either company could provide independently.
Read More →
Don't Wait for a Crisis: 5 Ways to Build Mental Health Into Your Fleet Safety Program
For Suicide Prevention Month, fleet and safety leaders have an opportunity to put mental health where it belongs: at the center of workplace safety.
Read More →
How Camera Data Can Strengthen a Fleet’s Insurance Renewal
Insights from a commercial insurance carrier and a broker show how fleets can turn video telematic data, driver coaching, and improved claims results into a stronger case at insurance renewal.
Read More →
The Safest Fleets Aren’t the Ones with the Most Technology
You’ve made the telematics investment. Here’s how to capture the other half of its value and build the safest fleet on the road.
Read More →
Sponsored•August 7, 2026
Hidden in Plain Sight: Fleet Compliance Risks
Fleet compliance isn't just about having policies — it's about consistently enforcing them. This practical guide reveals six hidden compliance risks common in public sector and shared fleet operations and outlines proven strategies to improve visibility, accountability, and audit readiness
Read More →
NETS Sets 2026 Fleet Safety Benchmark Conference for Indianapolis
The Sept. 15–17 program will feature fleet benchmarking data, case studies, emerging technologies, and implementation strategies while running alongside the NSC Safety Congress & Expo.
Read More →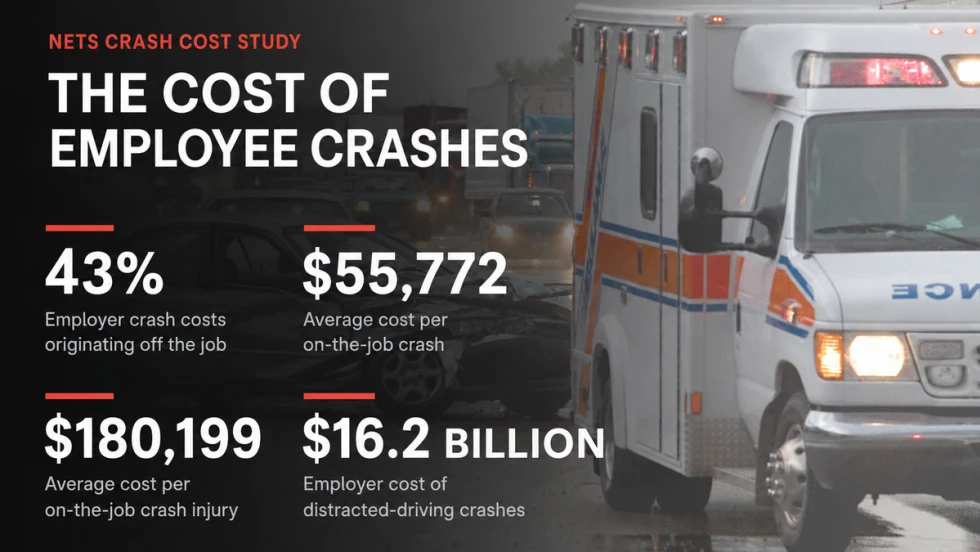
Off-the-Job Crashes Account for 43% of Employers’ $61.7 Billion Crash Burden
NETS quantifies costs dispersed across fleet, risk, HR, and other departments while providing new per-crash benchmarks for employers.
Read More →