




U.S. EIA Revises Gas Price Outlook, Projecting $3.56 per Gallon Average for Rest of 2012
WASHINGTON – The U.S. Energy Information Administration (EIA) adjusted its short-term outlook for retail gasoline prices downward for April through September.
WASHINGTON – The U.S. Energy Information Administration (EIA) adjusted its short-term outlook for retail gasoline prices downward for April through September. EIA said it expects retail gasoline prices to average $3.56 per gallon in 2012, and $3.51 per gallon in 2013 (based on current trends holding steady).
For oil prices, EIA said West Texas Intermediate crude oil spot prices averaged more than $100 per barrel during the first four months of the year. The spot price dropped $23 in a single month, from $106 per barrel on May 1 to $83 per barrel on June 1, in response to concerns about global economic growth and oil demand growth.
EIA said it projects the price of WTI crude oil to average $95 per barrel during the second half of 2012, and the average refiner acquisition cost to average $100 per barrel. Both figures are nearly $11 per barrel lower than the EIA’s projections last month, and EIA said oil prices will stay fairly flat in 2013. To make these projections, the EIA said it’s assuming GDP will grow by 2.2% for 2012 and 2.4% in 2013, and that world oil‐consumption‐weighted real GDP grows by 3.1% and 3.5% in 2012 and 2013, respectively. That said, EIA cautioned that it could adjust its projections further if economic growth forecasts are revised downward.
As for U.S. oil production, EIA said it will average 6.3 million barrels per day in 2012, which is an increase of 0.6 million barrels per day over 2011, and the highest level of production since 1998. In 2013, EIA projects domestic oil production will increase to 6.7 million barrels per day.
More Fuel

Turning Fleet Payment Data into Executive Insights
Ramel Lindsay of U.S. Bank Voyager discusses how fleets can transform payment and transaction data into actionable intelligence to reduce costs, improve oversight, and support executive decision-making.
Read More →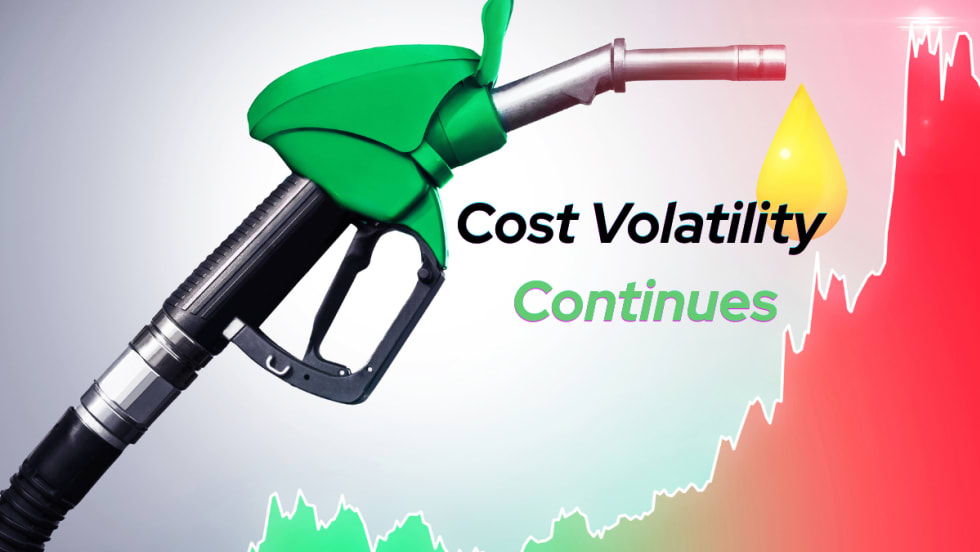
Why the IRS Raised Its Mileage Rate in the Middle of 2026
Fuel-price volatility drove the rare increase to 76 cents per mile, the fifth midyear adjustment since 2000.
Read More →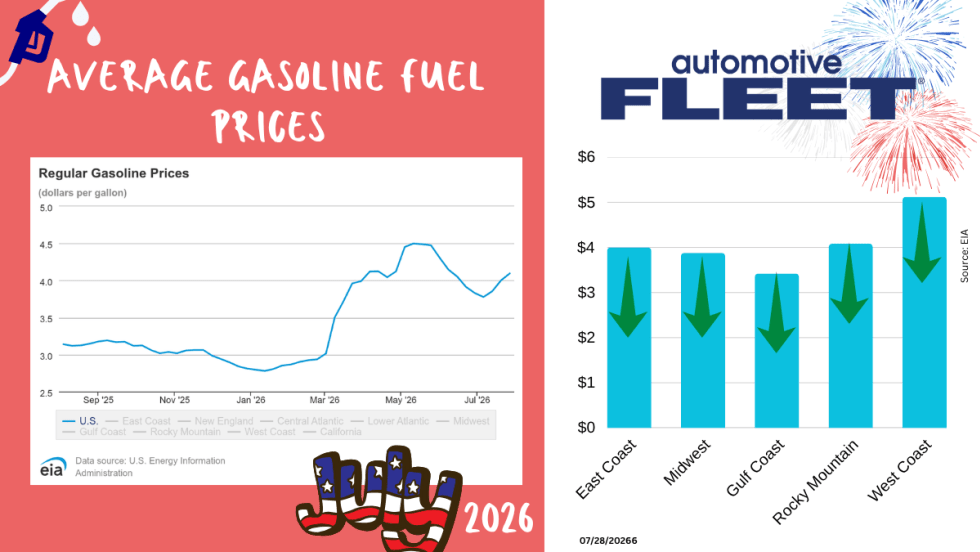
July Fuel Update: Prices Keep Rising in Light of More Conflict
Gas prices continue to rise as more and more conflicts do, too.
Read More →
Bob Adamsky on Fuel Volatility: "Don't Panic, Have a Plan."
When it comes to up and down fuel prices, Adamsky has a message for fleets: “Don’t panic.”
Read More →
How Fleets Can Gain Control of Non-Fuel Spend
Fuel often gets the spotlight, but non-fuel expenses can have a major impact on fleet costs. Ramel Lindsay of U.S. Bank Voyager discusses how fleets can gain better visibility and control over these often-overlooked expenditures.
Read More →
Fuel is Just the Start: How Middle East Tensions are Driving Up Fleet Maintenance Costs
The Middle East conflict is doing more than pushing up fuel prices. It’s also raising the cost of key maintenance products your fleet depends on, from motor oil to tires to windshield wipers. Here’s what you need to know about this budget-busting situation.
Read More →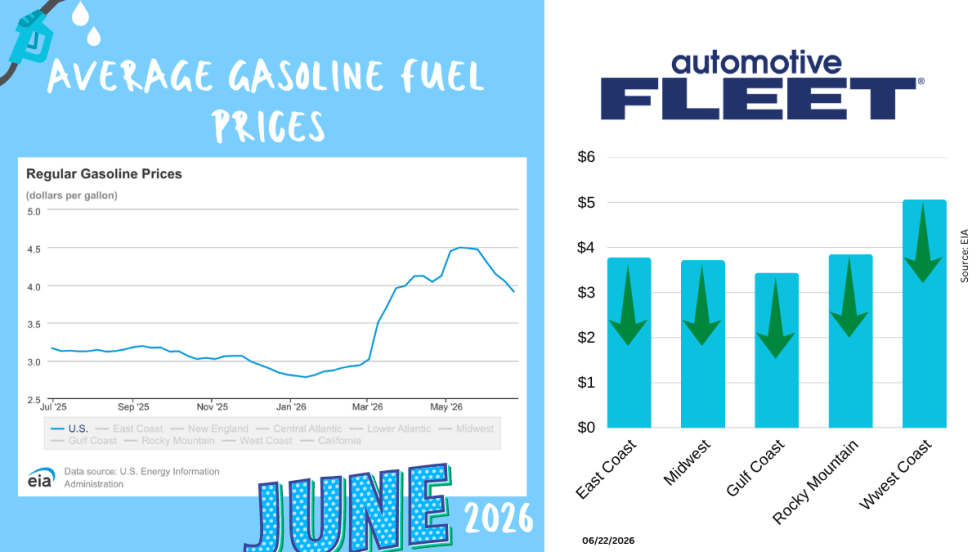
June Fuel Update: Prices Fall Below $4
Drivers are finally getting some relief at the pump. The national average gas price has dropped below $4 a gallon for the first time in months, with prices falling in 47 states as oil markets react to developments in U.S.-Iran negotiations.
Read More →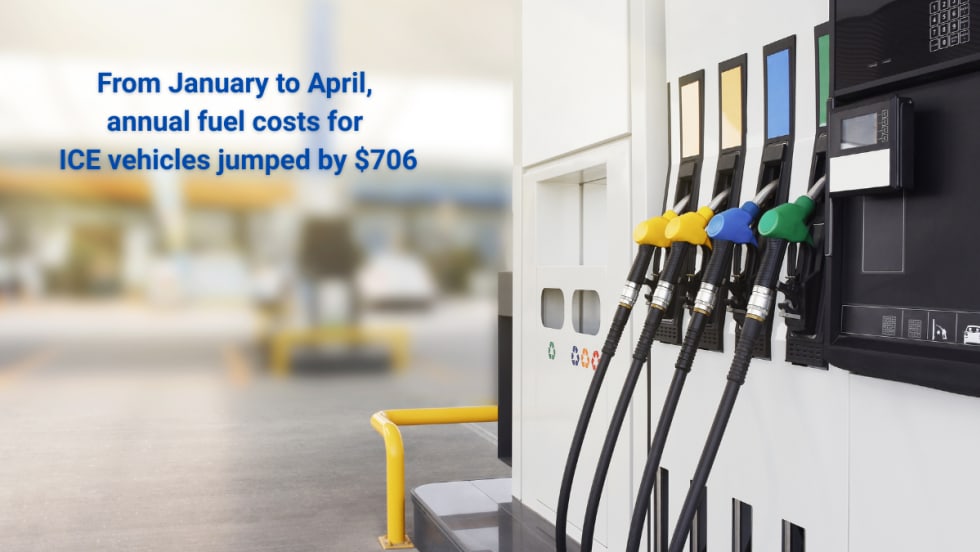
Study: How 2026's Gas Price Hikes Affect Different Vehicle Types
New data from iSeeCars reveals how rising fuel costs have affected different vehicle segments as gasoline prices climbed nearly 46% over the past four months.
Read More →
Are You Tracking Your Fleet's True Total Cost of Ownership?
Bobit Business Media surveyed 190 fleet professionals and found that while most fleets are tracking costs, fragmented systems and data gaps are keeping true TCO visibility out of reach. With rising pressure to control spend in an increasingly volatile environment, the gap between what fleets think they know and what the data actually shows is wider than you might expect. See how your peers are managing costs today and where the industry still has room to improve.
Read More →
May Fuel Update: All Regions Experience Declines
Gas prices are finally easing in much of the country, but experts warn global tensions could quickly reverse the trend as the national average remains well above last month’s levels.
Read More →