

Real-World Fuel Economy Improves Gradually
Fuel economy has seen a gradual increase in light-duty vehicles since the 1990s with a 1.8 mpg improvement in 2013, according to the University of Michigan's Transportation Research Institute.

Graph courtesy of the University of Michigan's Transportation Research Institute.

Graph courtesy of the University of Michigan's Transportation Research Institute.
Fuel economy has seen a gradual increase in light-duty vehicles since the 1990s with a 1.8 mpg improvement in 2013, according to the University of Michigan's Transportation Research Institute (UMTRI).
With the introduction of fuel saving technologies in the late 90s, light-duty vehicles have improved on-road fuel economy slower than expected. All light-duty vehicles saw a 10.2-percent improvement in fuel economy from 1991 to 2013, according to the study.
The fuel-economy data for cars shows a similar pattern when compared to all vehicles. Fuel economy decreased by 1.9 mpg from 1936 to 1973 and saw a recovery period from 1973 to 1991 (13.4 mpg to 21.2 mpg). For the next 22 years, car fuel economy increased gradually.
The report produced by the institute's Michael Sivak and Brandon Schoettle analyzes the changes in fuel economy of vehicles from 1923 to 2015.
According to the study, a key issue with improving fuel economy lies in turnonver of vehicles on the road. Improvements in fuel economy of new vehicles takes time to make an impact on the overall fuel economy.
The observations suggest that the focus should be on the lower tails of the distributions of fuel economy in each vehicle class, according to the report.
Information about distances driven and fuel consumed was used to calculate the actual, on-road fuel economy for all vehicles and for different classes of vehicles, with primary interest in light-duty vehicles (cars, pickup trucks, vans, and SUVs).
The findings this study presents serve as an update to a research report conducted in 2009. The previous study looked at actual, on-road vehicle fuel economy in the U.S. from 1923 to 2006. Sivak and Schoettle's study adds information such as retroactive adjustments that were made to different values by the U.S. Department of Transportation.
View the study's abstract for more information.
More Fuel

Turning Fleet Payment Data into Executive Insights
Ramel Lindsay of U.S. Bank Voyager discusses how fleets can transform payment and transaction data into actionable intelligence to reduce costs, improve oversight, and support executive decision-making.
Read More →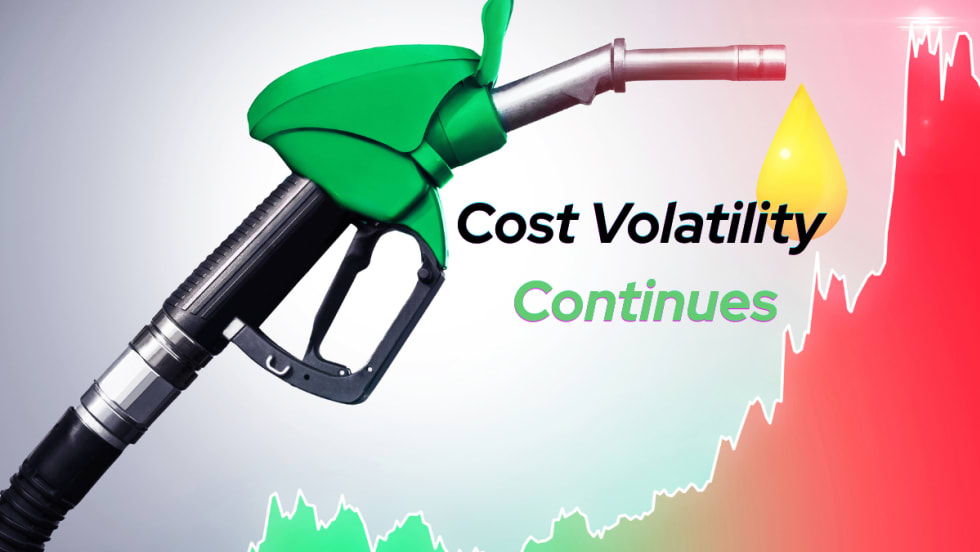
Why the IRS Raised Its Mileage Rate in the Middle of 2026
Fuel-price volatility drove the rare increase to 76 cents per mile, the fifth midyear adjustment since 2000.
Read More →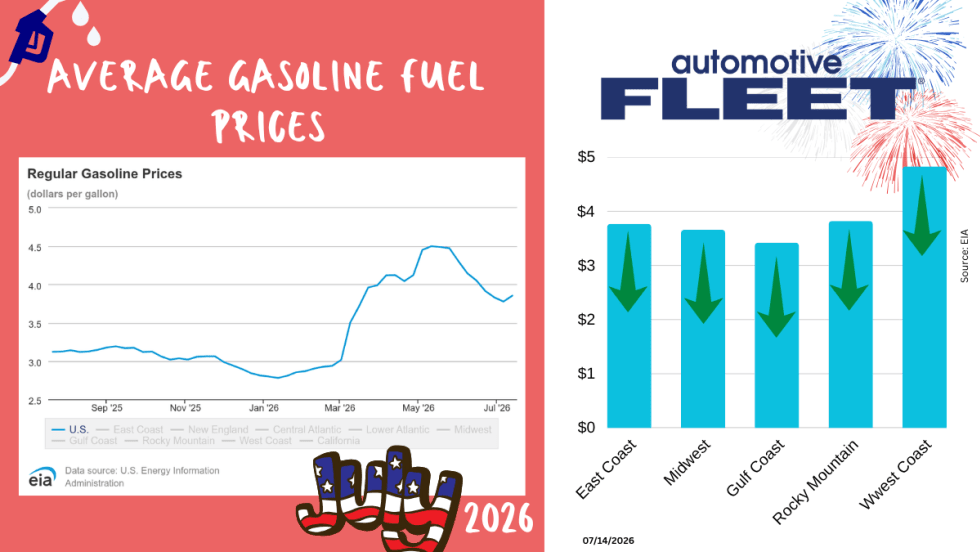
July Fuel Update: Prices Jump for the First Time in Two Months
As the U.S.-Iran ceasefire collapses, so do the gas prices.
Read More →
Bob Adamsky on Fuel Volatility: "Don't Panic, Have a Plan."
When it comes to up and down fuel prices, Adamsky has a message for fleets: “Don’t panic.”
Read More →
How Fleets Can Gain Control of Non-Fuel Spend
Fuel often gets the spotlight, but non-fuel expenses can have a major impact on fleet costs. Ramel Lindsay of U.S. Bank Voyager discusses how fleets can gain better visibility and control over these often-overlooked expenditures.
Read More →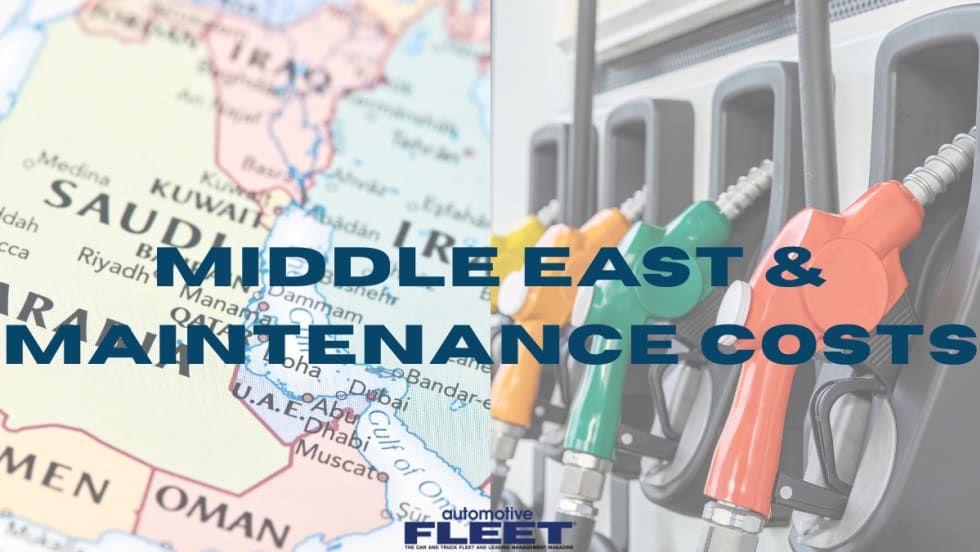
Fuel is Just the Start: How Middle East Tensions are Driving Up Fleet Maintenance Costs
The Middle East conflict is doing more than pushing up fuel prices. It’s also raising the cost of key maintenance products your fleet depends on, from motor oil to tires to windshield wipers. Here’s what you need to know about this budget-busting situation.
Read More →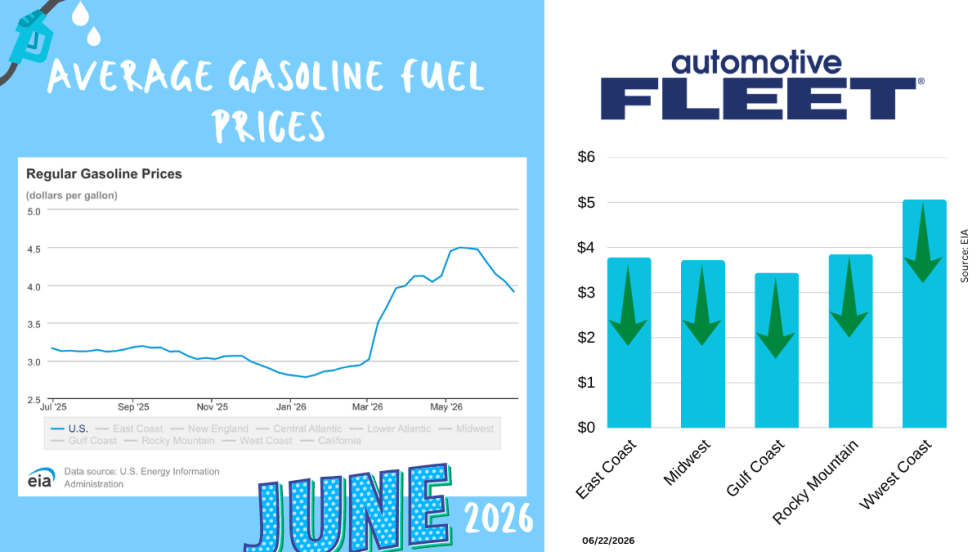
June Fuel Update: Prices Fall Below $4
Drivers are finally getting some relief at the pump. The national average gas price has dropped below $4 a gallon for the first time in months, with prices falling in 47 states as oil markets react to developments in U.S.-Iran negotiations.
Read More →
Study: How 2026's Gas Price Hikes Affect Different Vehicle Types
New data from iSeeCars reveals how rising fuel costs have affected different vehicle segments as gasoline prices climbed nearly 46% over the past four months.
Read More →Are You Tracking Your Fleet's True Total Cost of Ownership?
Bobit Business Media surveyed 190 fleet professionals and found that while most fleets are tracking costs, fragmented systems and data gaps are keeping true TCO visibility out of reach. With rising pressure to control spend in an increasingly volatile environment, the gap between what fleets think they know and what the data actually shows is wider than you might expect. See how your peers are managing costs today and where the industry still has room to improve.
Read More →
May Fuel Update: All Regions Experience Declines
Gas prices are finally easing in much of the country, but experts warn global tensions could quickly reverse the trend as the national average remains well above last month’s levels.
Read More →