

‘MythBusters’ Sets Out to Bust Fuel Efficiency Myths
SAN FRANCISCO - The Discovery Channel's television show "MythBusters" recently conducted several experiments to answer questions on fuel efficiency.
SAN FRANCISCO- The Discovery Channel's science television show "MythBusters", which by its namesake sets out to bust common myths and urban legends, recently conducted several experiments to answer questions on fuel efficiency.
In an episode titled, "Clean Car vs. Dirty Car", the show's scientists set out to discover whether a dirty car runs as efficiently as a clean one. The scientists began by rigging a special gauge to a nondescript sedan, measuring fuel usage to the ounce. To get a uniformly dirty car, the MythBusters used a pressurized sprayer to coat the car in a specialized blend of dirt and water. The aerodynamic clean car did, in fact, appear to run more efficiently than the dirty version.
Completing the answer to that question, the scientists then proceed to expand the experiment to full scale by encapsulating the car with 750 lbs. of clay, then carving out about 300 golf "dimples", creating a golf ball-like surface. The expected fuel efficiency was based on the demonstrated aerodynamics of a dimpled golf ball. After proving golf balls with dimples traveled much farther than a plain ball of the same size with a smooth surface, the team wanted to see if the theory would also hold true with a vehicle.
To the amusement and disbelief of the scientists conducting the experiment, cutting out golf-sized holes in the clay exterior of the vehicle resulted in an 11-percent increase in fuel efficiency. Click here to see the car in action.
More Fuel
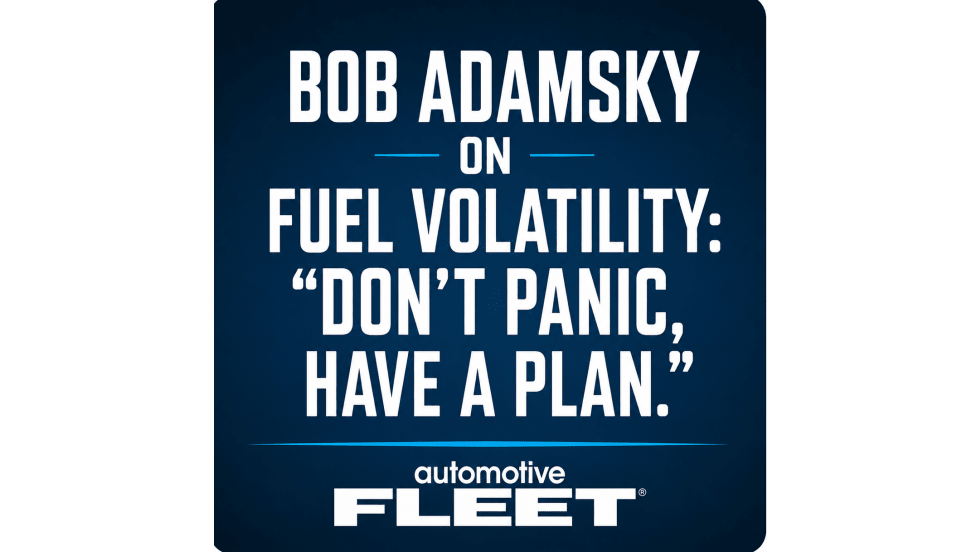
Bob Adamsky on Fuel Volatility: "Don't Panic, Have a Plan."
When it comes to up and down fuel prices, Adamsky has a message for fleets: “Don’t panic.”
Read More →
How Fleets Can Gain Control of Non-Fuel Spend
Fuel often gets the spotlight, but non-fuel expenses can have a major impact on fleet costs. Ramel Lindsay of U.S. Bank Voyager discusses how fleets can gain better visibility and control over these often-overlooked expenditures.
Read More →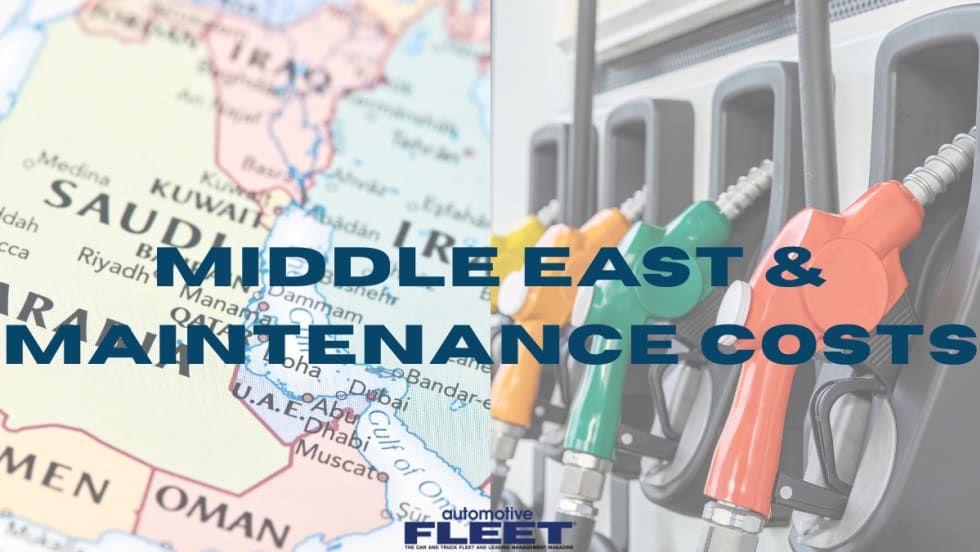
Fuel is Just the Start: How Middle East Tensions are Driving Up Fleet Maintenance Costs
The Middle East conflict is doing more than pushing up fuel prices. It’s also raising the cost of key maintenance products your fleet depends on, from motor oil to tires to windshield wipers. Here’s what you need to know about this budget-busting situation.
Read More →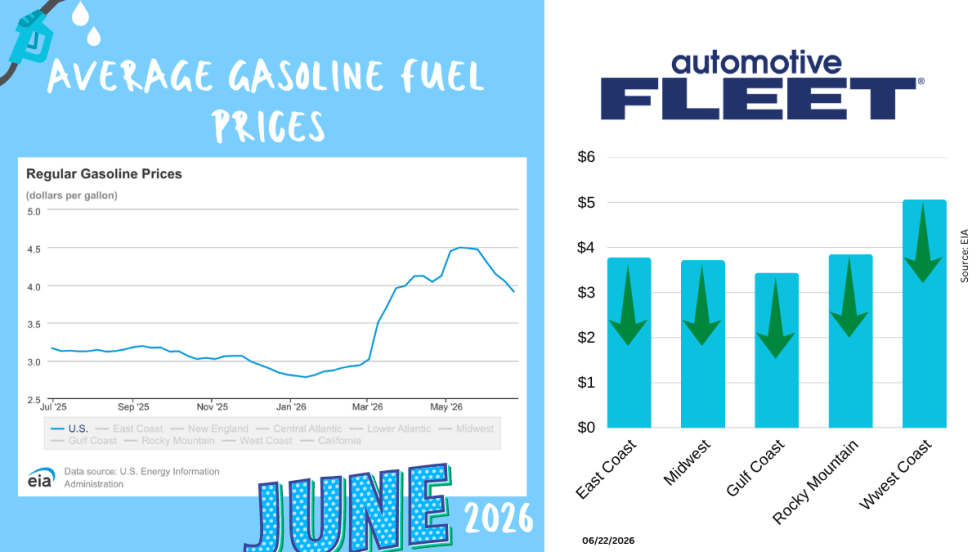
June Fuel Update: Prices Fall Below $4
Drivers are finally getting some relief at the pump. The national average gas price has dropped below $4 a gallon for the first time in months, with prices falling in 47 states as oil markets react to developments in U.S.-Iran negotiations.
Read More →
Study: How 2026's Gas Price Hikes Affect Different Vehicle Types
New data from iSeeCars reveals how rising fuel costs have affected different vehicle segments as gasoline prices climbed nearly 46% over the past four months.
Read More →Are You Tracking Your Fleet's True Total Cost of Ownership?
Bobit Business Media surveyed 190 fleet professionals and found that while most fleets are tracking costs, fragmented systems and data gaps are keeping true TCO visibility out of reach. With rising pressure to control spend in an increasingly volatile environment, the gap between what fleets think they know and what the data actually shows is wider than you might expect. See how your peers are managing costs today and where the industry still has room to improve.
Read More →
May Fuel Update: All Regions Experience Declines
Gas prices are finally easing in much of the country, but experts warn global tensions could quickly reverse the trend as the national average remains well above last month’s levels.
Read More →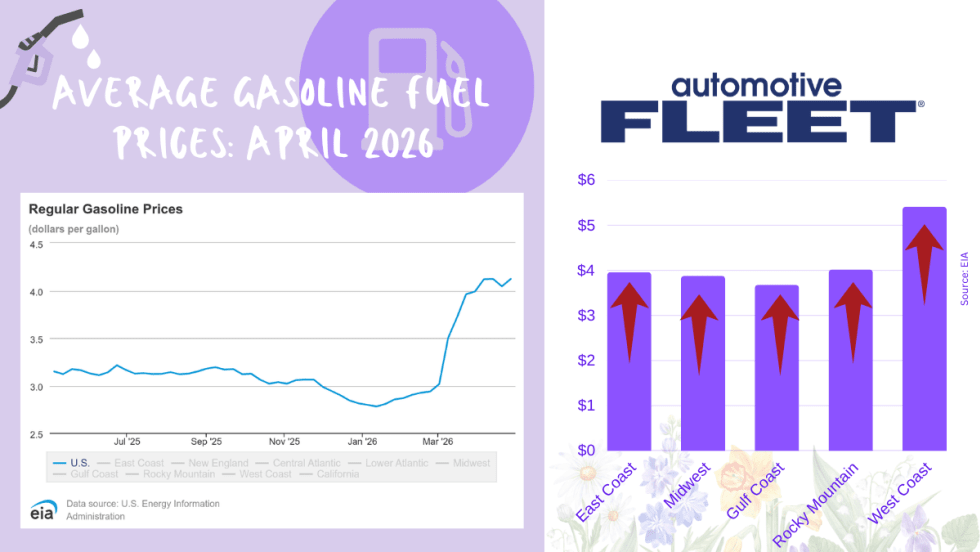
April Fuel Update: Prices Climb Above $4 as Spring Surge Accelerates
National average jumps to $4.04 per gallon, up sharply from last year, with West Coast prices topping $5 and further increases expected amid rising oil tensions.
Read More →
Tips from Fleet Managers on Saving Fuel Costs
Fleet leaders share practical strategies to reduce fuel spend through smarter policy, routing, and driver guidance.
Read More →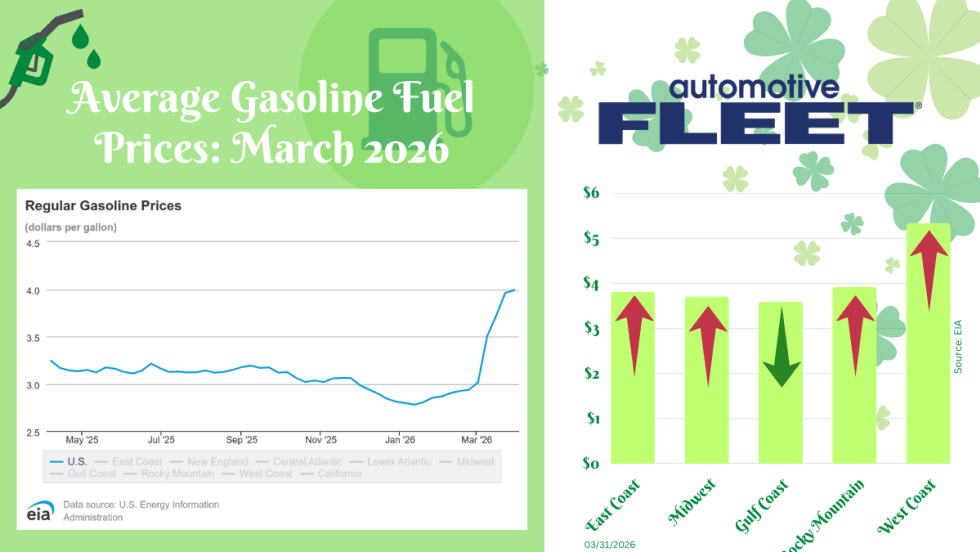
March Fuel Update: Prices Settle With a $4 Average
Fuel prices significantly slowed this week, but a $4 national average is still expected.
Read More →