

Hyundai and Kia to Adjust Fuel Economy Ratings for 2011 to 2013-MY Vehicles
ORANGE COUNTY, CA – Hyundai and Kia are adjusting the fuel economy ratings for approximately 900,000, or 35%, of 2011-2013 model-year vehicles sold through Oct. 31, 2012.
ORANGE COUNTY, CA – Hyundai and Kia are adjusting the fuel economy ratings for approximately 900,000, or 35%, of 2011-2013 model-year vehicles sold through Oct. 31, 2012.
The companies stated they are taking this voluntary effort after discussions with the U.S. Environmental Protection Agency (EPA). Hyundai and Kia said procedural errors at the automakers’ joint testing operations in Korea led to incorrect fuel economy ratings. The companies added that this adjustment will reduce the fuel economy of the 2012 Hyundai/Kia fleet by an average of 3%, from 27 mpg to 26.
Hyundai models affected include the 2011 Elantra and Sonata HEV, the 2012 Accent, Azera, Elantra, Genesis, Sonata HEV, Tucson, Tucson 4WD, and Veloster. They also include the 2013 Accent, Azera, Elantra, Elantra Coupe, Elantra GT, Genesis, Santa Fe Sport 2WD and 4WD, the Tucson 2WD and 4WD, and the Veloster. Kia models affected include the 2011-2012 Optima HEV, and the 2012-2013 Rio, Sorrento, Soul, Soul ECO, and Sportage.
To compensate for this error, the companies are setting up a reimbursement program for affected vehicle owners to cover the additional cost of fuel due to the fuel economy rating change. The program will provide customers with a personalized debit card that will reimburse them for the difference between the previous and adjusted combined EPA fuel economy numbers, and will take into account the fuel price in the customer’s area and actual miles driven. The companies added they will add 15% to the reimbursement amount to compensate for the inconvenience caused by the fuel economy discrepancy.
Further explaining the procedural errors, the companies stated that the testing process with the errors is called “coastdown.”Coastdown simulates aerodynamic drag, tire rolling resistance, and fuel economy loss due to friction in the drivetrain. This testing process provides the EPA with the data used to program the test dynamometers the EPA uses to generate its fuel economy ratings.
You can visit Hyundai’s website here, and Kia’s here, for more information about the models affected and the reimbursement program.
More Fuel
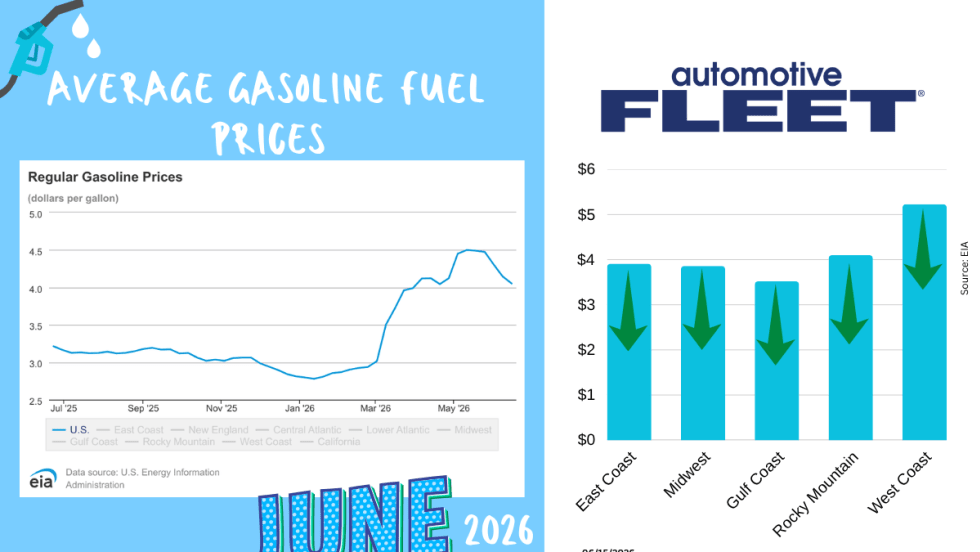
June Fuel Update: Prices Fall Below $4
Drivers are finally getting some relief at the pump. The national average gas price has dropped below $4 a gallon for the first time in months, with prices falling in 47 states as oil markets react to developments in U.S.-Iran negotiations.
Read More →
Study: How 2026's Gas Price Hikes Affect Different Vehicle Types
New data from iSeeCars reveals how rising fuel costs have affected different vehicle segments as gasoline prices climbed nearly 46% over the past four months.
Read More →Are You Tracking Your Fleet's True Total Cost of Ownership?
Bobit Business Media surveyed 190 fleet professionals and found that while most fleets are tracking costs, fragmented systems and data gaps are keeping true TCO visibility out of reach. With rising pressure to control spend in an increasingly volatile environment, the gap between what fleets think they know and what the data actually shows is wider than you might expect. See how your peers are managing costs today and where the industry still has room to improve.
Read More →
May Fuel Update: All Regions Experience Declines
Gas prices are finally easing in much of the country, but experts warn global tensions could quickly reverse the trend as the national average remains well above last month’s levels.
Read More →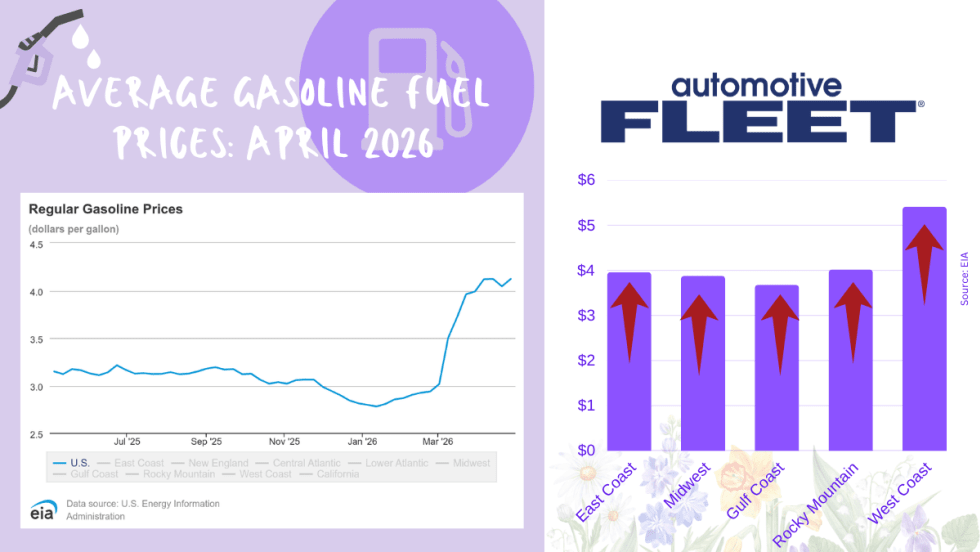
April Fuel Update: Prices Climb Above $4 as Spring Surge Accelerates
National average jumps to $4.04 per gallon, up sharply from last year, with West Coast prices topping $5 and further increases expected amid rising oil tensions.
Read More →
Tips from Fleet Managers on Saving Fuel Costs
Fleet leaders share practical strategies to reduce fuel spend through smarter policy, routing, and driver guidance.
Read More →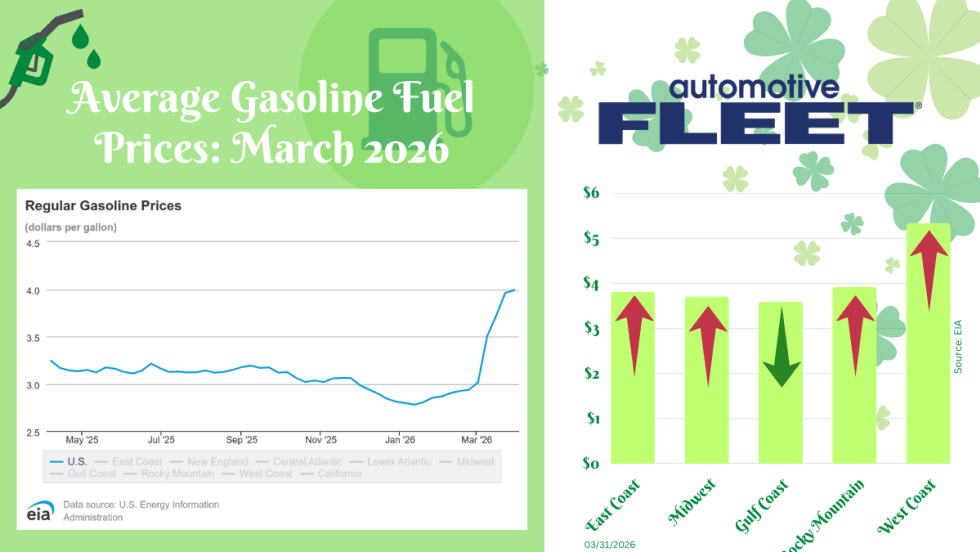
March Fuel Update: Prices Settle With a $4 Average
Fuel prices significantly slowed this week, but a $4 national average is still expected.
Read More →
Bob Adamsky on Fuel Volatility: “Don’t Panic — Have a Plan”
With oil prices rising again, AWP Safety’s fleet manager shares how to respond to rising fuel costs and how the right strategy can turn fuel spikes into cost-saving opportunities.
Read More →
Oil Market Turbulence Is Complicating Fleet Cost Planning
Rapid swings in crude oil prices driven by the conflict in the Middle East could create longer-term cost pressures for fleets, affecting fuel prices, supply chains, and vehicle strategy, says NTEA’s Andrew Wrobel.
Read More →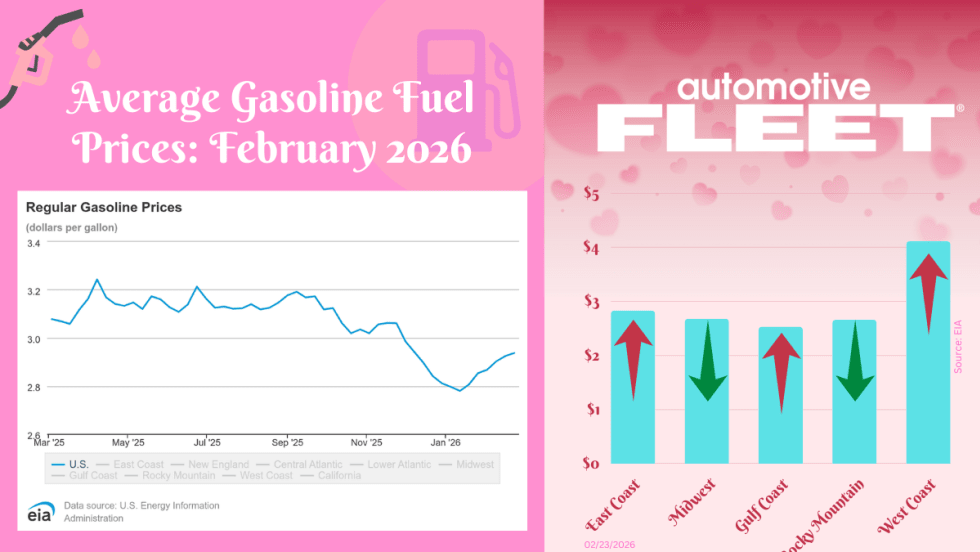
February Fuel Update: Prices Inch Higher for Third Week in a Row
The final February fuel update reveals prices continuing to inch higher for the third week in a row.
Read More →