Automotive Fleet
MenuMENU
SearchSEARCH
Enter keywords to search across all content
Series of colored line graphs showing the recent history of average used listing prices.
Newsby News/Media ReleaseJune 12, 2026

Used Vehicle Prices Climb Higher As Sales Pace Slows

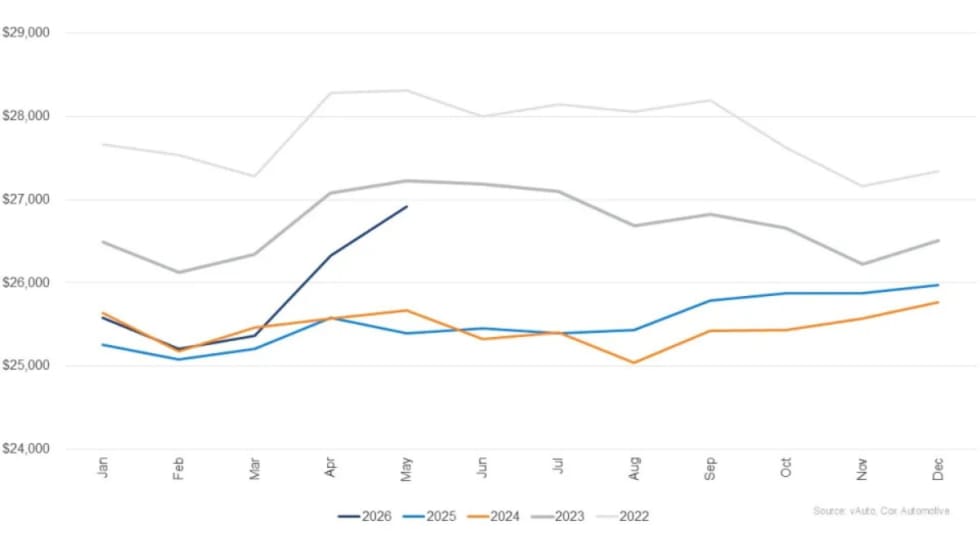
The higher prices at used retail reflect strong wholesale values earlier in the spring, particularly for older, more affordable vehicles.

Read More →
Dark blue bar graphs showing percentage gains in average wholesale used vehicle prices
Newsby News/Media ReleaseJune 5, 2026

Wholesale Used Vehicle Market Sustains Moderate Rise In Values, Prices

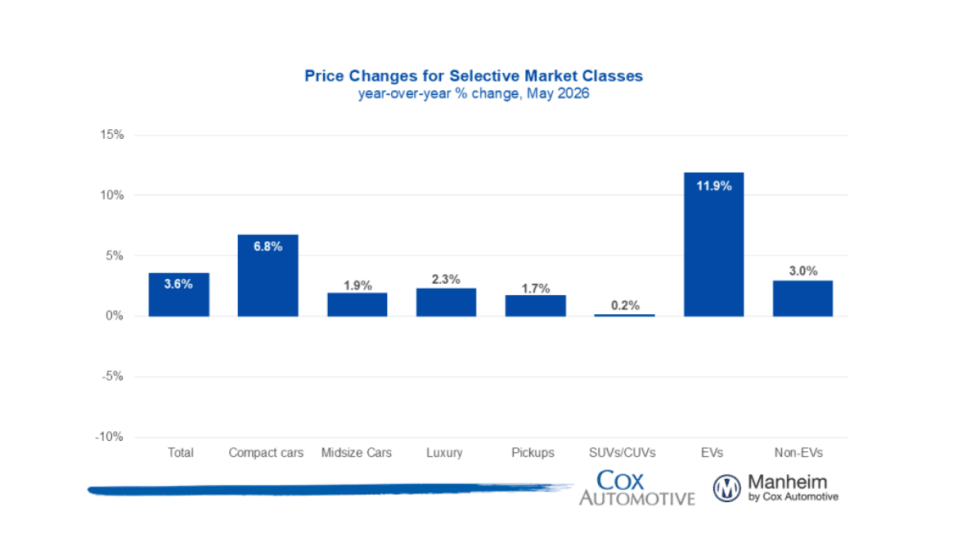
Trends continue to normalize after a strong start to the year, as consumers contend with higher gas prices in the coming summer months.

Read More →
Line comparisons of used vehicle inventory set in different colors.
Newsby News/Media ReleaseApril 20, 2026

March Used Vehicle Inventory Falls To Lowest Since 2019

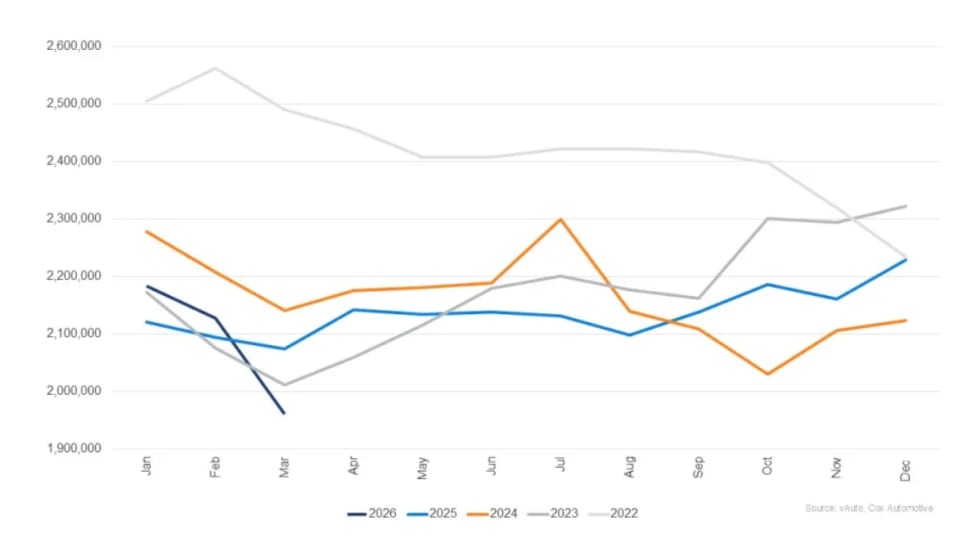
Franchised and independent dealers had a total of 1.95 million used vehicles in stock in March, the lowest on record in the current data set.

Read More →
Ad Loading...
Newsby News/Media ReleaseFebruary 9, 2026

Up In 2026: Wholesale Used Vehicle Prices, Values

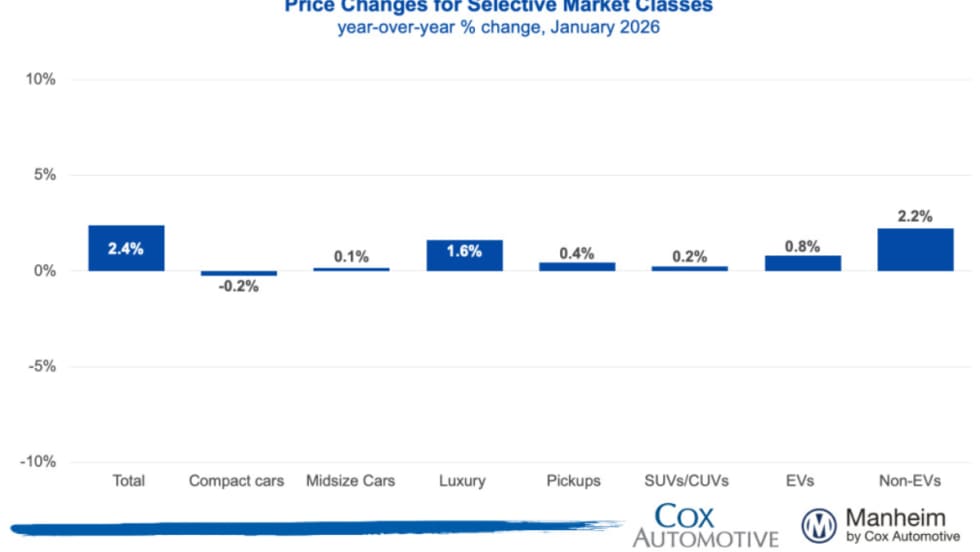
Wholesale values moved even faster than expected on the back of strong retail demand, driving the MUVVI to its highest reading since September 2023.

Read More →
Colored bar graph lines show vehicle listing prices.
Newsby News/Media ReleaseDecember 15, 2025

Used Vehicle Inventory Hits New 2025 High

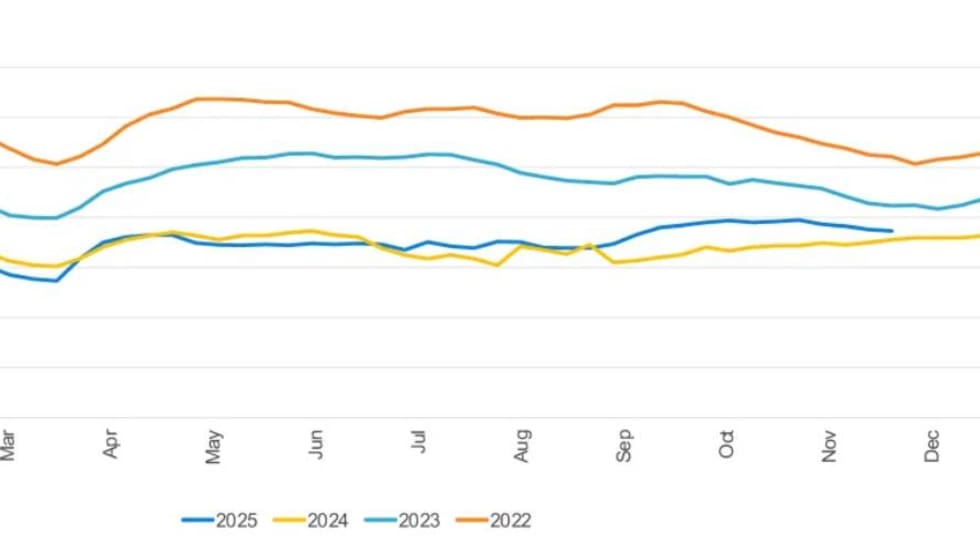
Vehicle buyers are seeing a favorable purchasing window, with factors such as declining prices, improving used vehicle credit rates, and continued gains in credit availability.

Read More →
Colored line graphs comparing average listing prices of used vehicles from 2022-2025.
Newsby News/Media ReleaseNovember 17, 2025

Used Vehicle Sales, Inventory, Prices Rise In October

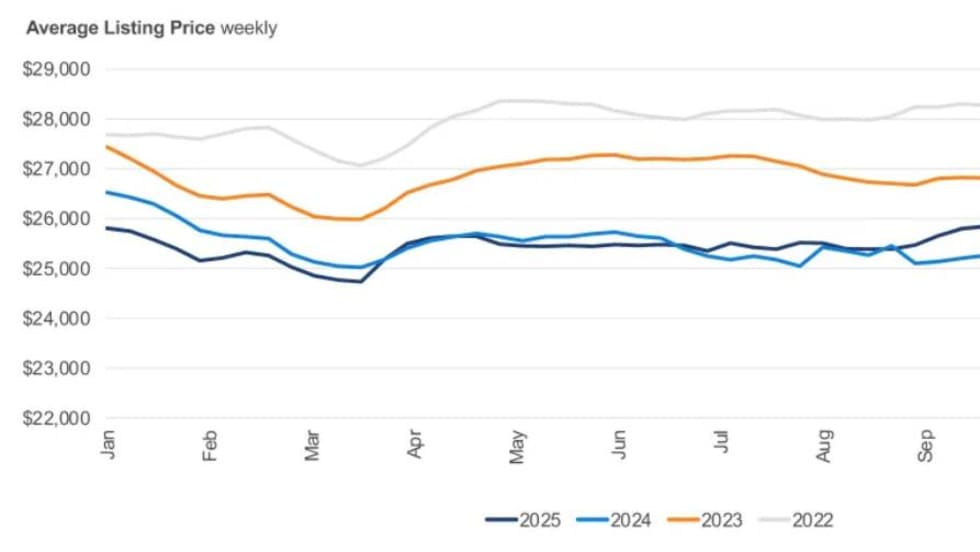
Better affordability compared to new vehicles and a larger selection of newer model year vehicles rank among the drivers of this market.

Read More →
Ad Loading...
Dark blue bar graphs show rises and declines in vehicle segment sales.
Newsby StaffNovember 13, 2025

Wholesale Used Vehicle Prices Decline In October

As the month progressed, used retail sales were higher each week, ending with tighter inventory levels.

Read More →
Chart showing September 2025 EV sales. New EV sales totaled 147,716 units, up 44% year over year, and used EV sales hit 40,569 units, up 76%, marking strong third-quarter performance.
Newsby News/Media ReleaseOctober 23, 2025

Q3 Electric Vehicles Sales Hit Record High

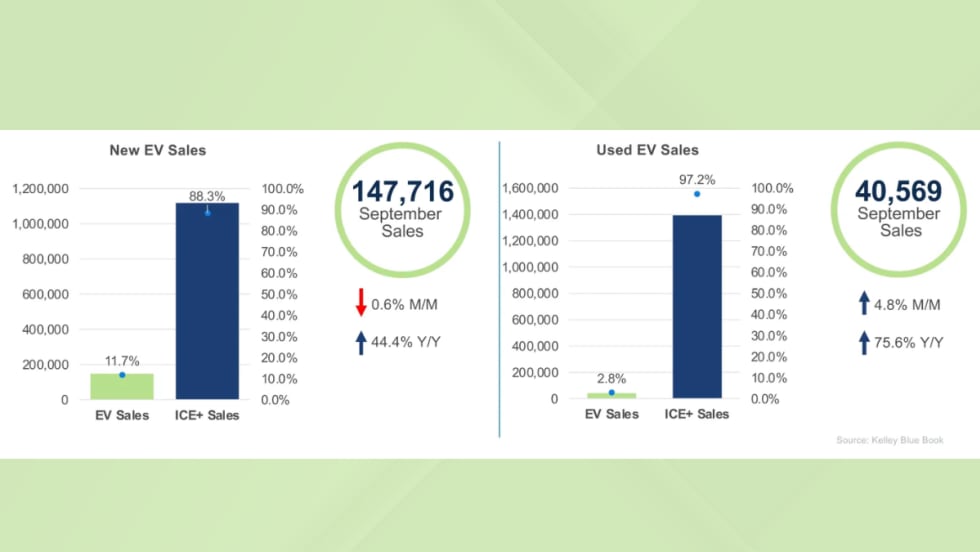
EV buyers took advantage of the final federal tax credit days, while average prices edged up for new EVs and continued to decline for used models.

Read More →
Chart showing higher EV sales trend for August
Newsby News/Media ReleaseSeptember 23, 2025

EV Sales Spike for Second Month in a Row

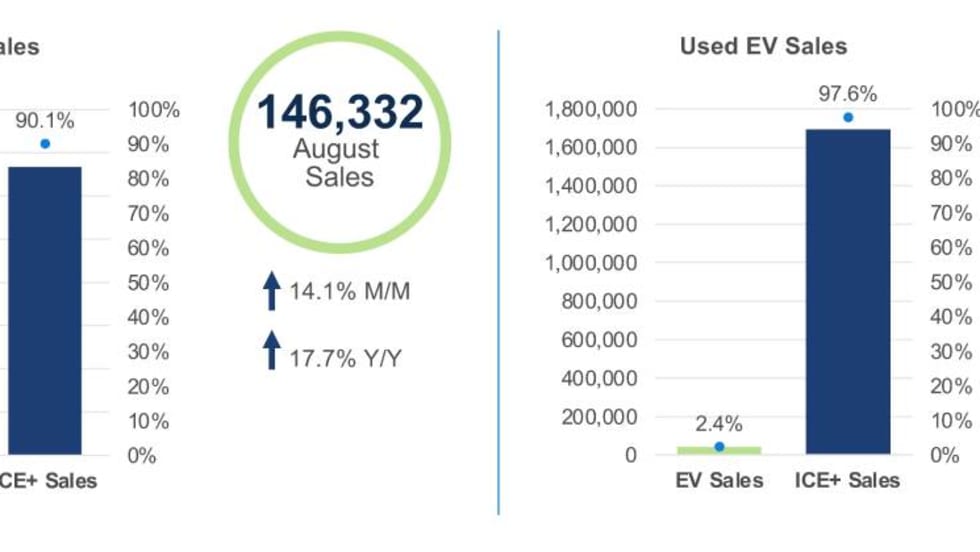
Consumers are buying up electric vehicles ahead of the Inflation Reduction Act’s tax credit expiration amid strong demand and tight inventory.

Read More →
Ad Loading...
A trend-line graph comparing average used vehicle prices since 2022.
Newsby News/Media ReleaseSeptember 12, 2025

Used Vehicle Inventory, Sales Climb

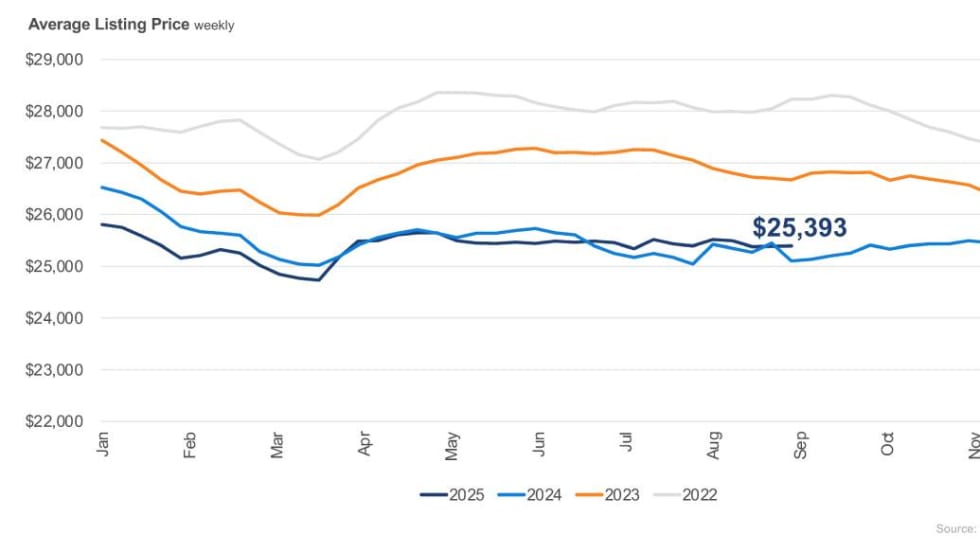
The used market especially benefits from consumers seeking more affordable alternatives than those offered in the new car segment.

Read More →