

U.S. Oil Demand Drops Due to Tight Markets, Hurricanes
WASHINGTON, D.C. --- Higher oil prices, arising from tight global crude oil markets and Gulf Coast hurricane damage, led to lower U.S. demand and record product imports in 2005, the American Petroleum Institute reported in its monthly statistical report.
WASHINGTON, D.C. --- Higher oil prices, arising from tight global crude oil markets and Gulf Coast hurricane damage, led to lower U.S. demand and record product imports in 2005, the American Petroleum Institute (API) reported in its monthly statistical report. “Growth in gasoline demand slowed to a fraction of the rate that it had averaged during the previous three years,” observed Ronald J. Planting, APR's manager of information and analysis. The major hurricanes that slammed the Gulf Coast in late August and September continued to have lingering effects even at year-end, Planting said. The supply impact of the two unprecedented hurricanes, combined with increased fuel demand over the Labor Day weekend, led to record prices, said Dr. John Felmy, API chief economist and director of statistics. “While the industry has succeeded in restoring much of the damaged assets to full production, some remain offline as repairs are made,” Felmy said. He noted that restoration of production has moved as rapidly as is possible given the need to restore operations only when certain that the environment will not be adversely affected. This year will continue to present challenges to the industry, Felmy said, noting the upcoming requirement for ethanol use in gasoline starting in May, and the introduction of ultra-low sulfur diesel fuel on June 1. The API Monthly Statistical Report for December, which includes supply and demand statistics for the year 2005, showed that offshore production of oil and natural gas was still operating at substantially below pre-hurricane rates, and refinery output still lagged year-ago levels as several refineries remained less than fully operational. Significantly higher gasoline prices in 2005 partially offset the effects of a strong economy, and gasoline deliveries, a key measure of demand, rose only 0.4 percent for the year, API reported. That's a noticeable contrast with growth in the previous three years, which averaged nearly 2 percent annually. Highway diesel demand continued to rise in 2005, API reported. But because of a partially offsetting decline for the rest of the distillate fuel oil market, deliveries of distillate fuel oil overall rose just 0.8 percent. Industrial and utility users seeking alternatives to tight supplies of natural gas helped propel residual fuel oil deliveries 6.6 percent higher, API reported. But jet fuel deliveries declined and hurricane disruptions of Gulf Coast gas processing and petrochemical industries led to a drop in petrochemical feedstock use. The net result was a decline in overall U.S. petroleum deliveries of 0.6 percent for the year, their first annual drop in four years. Even with substantial recovery in refinery operations over the last several months, API said refinery inputs, an overall measure of activity at refineries, were still down nearly 5 percent from a year ago. By contrast, during the first half of 2005, inputs had surpassed year-ago levels by an average 1.4 percent compared with the same period a year earlier, setting an all-time high of 15.84 million barrels per day. At year-end, roughly 1 million barrels per day of hurricane-affected U.S. refinery capacity had still not returned to normal operations. Inputs for the year as a whole, down 2 percent, showed the first annual decline in three years. Product imports surged nearly 14 percent in 2005 to an all-time high of 3.48 million barrels per day. Product imports' share of domestic consumption also reached an all-time high of close to 17 percent, API reported. Growth for gasoline imports was especially strong, rising more than 20 percent to exceed 1 million barrels per day for the first year ever. Gasoline imports, including blending components, accounted for more than 12 percent of all gasoline used in the United States in 2005. Residual fuel imports also surged nearly 25 percent to 531,000 barrels per day. But with tight world markets for distillate fuel oil, imports of that product barely held steady, despite strong U.S. demand for diesel. Crude oil imports slipped marginally for the year. But because of the jump in product imports, overall U.S. imports rose 2.6 percent to 13.49 million barrels per day. U.S. imports of crude and products in 2005 amounted to about 65 percent of domestic consumption. Domestic crude production in December posted its third consecutive monthly increase, API reported, as Gulf producers continued to recover from the impacts of the devastating hurricane season. U.S. crude production for the year, however, saw its largest annual percentage decrease since 1949 -- a drop of 6.6 percent -- because the equivalent of about 7.5 percent of crude production in the lower 48 states went unproduced. This was the result of precautionary shut-ins and equipment damage. Crude oil inventories remained above the corresponding five-year average for nearly every month in 2005. They ended the year at 320 million barrels ---12 percent above a year earlier and a similar percentage above the five-year average for December. Distillate inventories, at 135 million barrels, finished the year more than 7 percent ahead of a year earlier. But gasoline inventories were 5 percent lower than their five-year December average, at 207 million barrels.
More Fuel
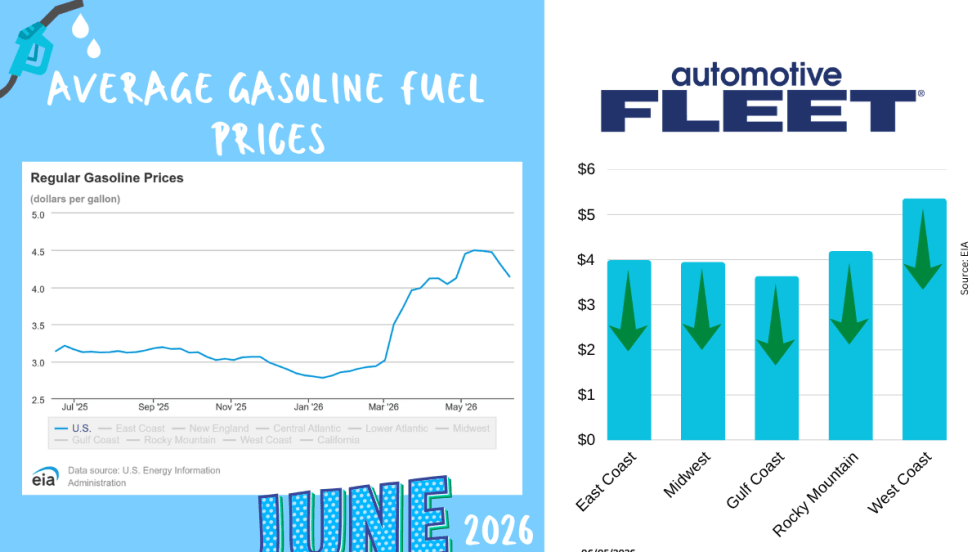
June Fuel Update: Prices Continue to Fall
While prices have continued to decline for four straight weeks, the next weeks don't look as promising.
Read More →
Study: How 2026's Gas Price Hikes Affect Different Vehicle Types
New data from iSeeCars reveals how rising fuel costs have affected different vehicle segments as gasoline prices climbed nearly 46% over the past four months.
Read More →Are You Tracking Your Fleet's True Total Cost of Ownership?
Bobit Business Media surveyed 190 fleet professionals and found that while most fleets are tracking costs, fragmented systems and data gaps are keeping true TCO visibility out of reach. With rising pressure to control spend in an increasingly volatile environment, the gap between what fleets think they know and what the data actually shows is wider than you might expect. See how your peers are managing costs today and where the industry still has room to improve.
Read More →
May Fuel Update: All Regions Experience Declines
Gas prices are finally easing in much of the country, but experts warn global tensions could quickly reverse the trend as the national average remains well above last month’s levels.
Read More →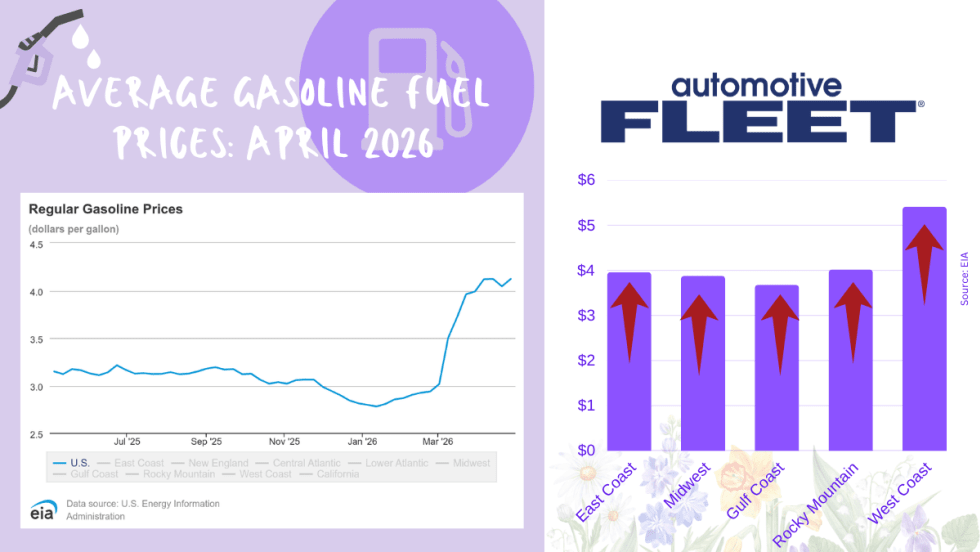
April Fuel Update: Prices Climb Above $4 as Spring Surge Accelerates
National average jumps to $4.04 per gallon, up sharply from last year, with West Coast prices topping $5 and further increases expected amid rising oil tensions.
Read More →
Tips from Fleet Managers on Saving Fuel Costs
Fleet leaders share practical strategies to reduce fuel spend through smarter policy, routing, and driver guidance.
Read More →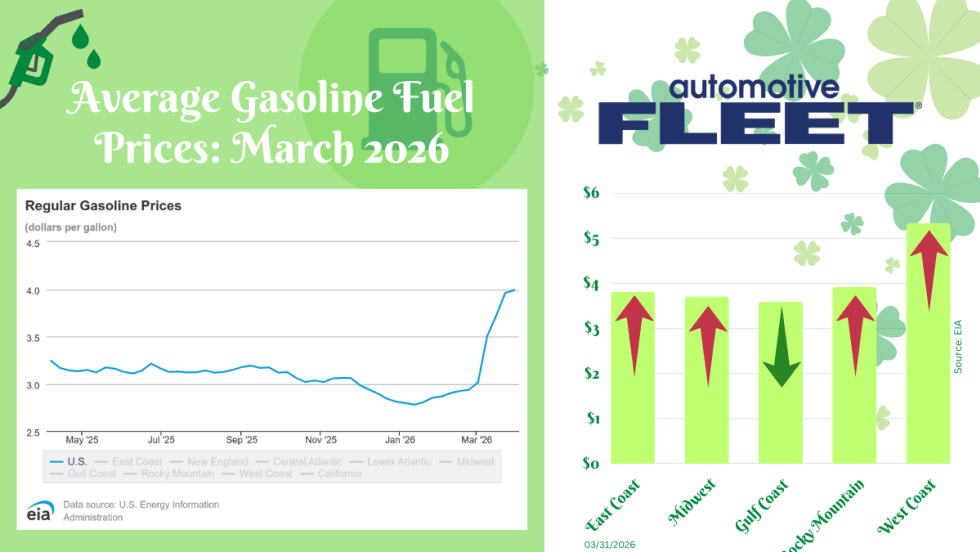
March Fuel Update: Prices Settle With a $4 Average
Fuel prices significantly slowed this week, but a $4 national average is still expected.
Read More →
Bob Adamsky on Fuel Volatility: “Don’t Panic — Have a Plan”
With oil prices rising again, AWP Safety’s fleet manager shares how to respond to rising fuel costs and how the right strategy can turn fuel spikes into cost-saving opportunities.
Read More →
Oil Market Turbulence Is Complicating Fleet Cost Planning
Rapid swings in crude oil prices driven by the conflict in the Middle East could create longer-term cost pressures for fleets, affecting fuel prices, supply chains, and vehicle strategy, says NTEA’s Andrew Wrobel.
Read More →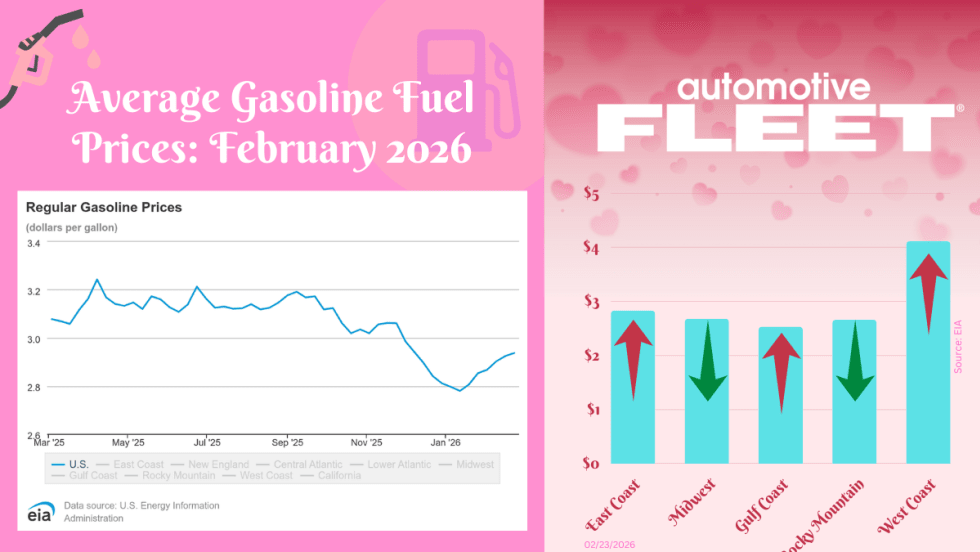
February Fuel Update: Prices Inch Higher for Third Week in a Row
The final February fuel update reveals prices continuing to inch higher for the third week in a row.
Read More →