




Pedestrian Road Deaths Dropping
Preliminary data for the first half of 2013 indicate an 8.7-percent drop, compared to the same period in 2012, GHSA reports.
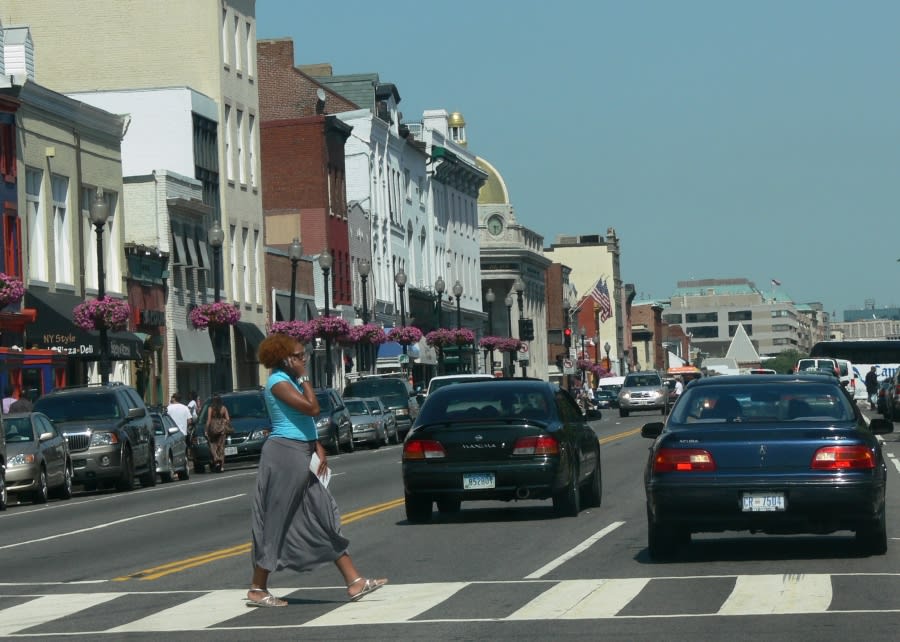
Photo courtesy of AAA Foundation for Traffic Safety.
Photo courtesy of AAA Foundation for Traffic Safety.
For the first time since 2009, the number of pedestrians killed on U.S. roadways is declining. Compared with the first six months of 2012, pedestrian deaths fell 8.7 percent during the first half of 2013, according to a new report released by the Governors Highway Safety Association (GHSA).
Specifically, there were 190 fewer fatalities, comparing pedestrian fatality data for January through June 2013 (1,985) with the same time period in 2012 (2,175).
"Pedestrian Traffic Fatalities by State: 2013 Preliminary Data" notes that states that saw decreases slightly outnumbered states with increases. But there were more states that had large decreases, particularly Florida (-55) and California (-37).
Concerns about a 15-percent increase in pedestrian deaths nationwide between 2009 and 2012, coupled with a 3-percent decrease in all other motor vehicle fatalities during the same time period, prompted GHSA to conduct the study.
The study relied on preliminary data provided by the 50 state highway safety offices and the District of Columbia. Dr. Allan Williams, former chief scientist at the Insurance Institute for Highway Safety, compared data from 2012 and 2013.
A 2010 GHSA study of pedestrian roadway deaths used this same methodology, and it proved to be quite accurate when compared with the final data, GHSA said.
"The preliminary findings are good news, but it's too soon to celebrate," said Kendell Poole, GHSA chairman and director of the Tennessee Office of Highway Safety. "Recognizing that the safety of all roadway users is a priority for the association and our members, we must remain focused on pushing the numbers down in all 50 states. With distraction an increasing issue for both pedestrians and motorists, pedestrian safety continues to be a priority in many areas of the country."
That effort is not without challenges, Williams pointed out. "Roadways are primarily designed to accommodate motor vehicle travel, so pedestrians are clearly at a disadvantage,” he said. “Add in the mass differential when a pedestrian and a vehicle collide, and the consequences can be serious for the person on foot."
States with the most pedestrian fatalities primarily have large populations and large urban centers. In 2012 and the first six months of 2013, three states -- California, Texas and Florida -- accounted for a third of all pedestrian deaths reported. And in 2012, pedestrian deaths represented 25 percent of all motor vehicle fatalities in states such as New Jersey, New York and Delaware. The lowest percentages of pedestrian fatalities are in predominantly rural states such as South Dakota (2 percent), North Dakota (4 percent) and Wyoming (5 percent).
Worldwide, pedestrians comprise 22 percent of the 1.24 million yearly traffic deaths, with many of the fatalities occurring in low- and middle-income countries. While pedestrian deaths in the U.S. have declined from 7,516 in 1975 (the first year in which data from FARS were compiled) to an all-time low of 4,109 in 2009, the number has been rising at an annual average rate of 4.9 percent ever since.
Why the numbers increased in 2010-2012 remains unclear. "The 2008-2009 economic recession may have driven the recent uptick, as more people were walking to lower their transportation costs," Williams said. "The focus on walking for health and environmental benefit also may have been factor."
Although explaining 2013’s decline in pedestrian deaths is a challenge, this decrease is consistent with the National Highway Traffic Safety Administration's early estimate of a 4-percent drop in total motor vehicle deaths for the first half of 2013.
States are using a combination of engineering, education and enforcement to combat the problem. For example, North Carolina adopted a “Complete Streets” policy in 2009, in which roadways are designed and operated to enable safe access for all users. Other engineering changes likely to promote pedestrian safety include adding midblock crossings and median refuge islands, as well as implementing leading pedestrian crossing signals at intersections.
Enforcement and education tactics include pedestrian decoys -- plainclothes police officers placed in marked crosswalks to identify and warn or cite motorists who do not yield the right of way -- and anti-jaywalking campaigns.
In Washington, D.C., an automated enforcement pilot program is underway to help curb motorist violations that put pedestrians at risk. The city has installed cameras at 20 intersections controlled by a stop sign and at another 20 uncontrolled crosswalks. The city also has a significant number of red-light and speed cameras in place that are credited with producing a measurable decline in vehicle speeds.
"Reducing speeding, particularly in areas frequented by pedestrians, is key," stressed Williams. "The odds of a pedestrian surviving a crash with a car traveling 20 mph or slower are good; at higher speeds, the impact can be fatal."
More Safety
IIHS Crash Avoidance Tests Reveal Safety Gaps in Cargo Vans and Work Trucks
New crash-avoidance ratings from the Insurance Institute for Highway Safety reveal inconsistent performance among commercial vehicles, with several popular cargo vans and heavy-duty pickups struggling to avoid collisions with other vehicles and pedestrians.
Read More →
What’s Next for Fleet? Safety, AI & Industry Recognition | AF News Recap
Could your company's culture be encouraging distracted driving? This week, we're exploring how workplace expectations affect driver safety, what AI, EVs, and autonomous vehicles could mean for the future of fleet management, and how fleet professionals can strengthen their award nominations.
Read More →
Does Your Fleet's Culture Encourage Distracted Driving?
What happens when the people responsible for enforcing safety rules are the ones setting the wrong example? The answer may reveal why some of the biggest risks to fleet drivers have little to do with what's written in the employee handbook.
Read More →
Fleet Manager’s Ultimate Playbook: Navigating the New Standard in OEM Connectivity
Rising operating costs, driver safety concerns, and unplanned downtime are putting unprecedented pressure on modern fleets. Discover how fleet managers use embedded OEM connectivity and real-time vehicle data to cut TCO, prevent downtime, and protect drivers without aftermarket telematics hardware.
Read More →
From Driver Well-Being to EV Charging | AF News Recap
Mental health belongs in the fleet safety conversation. This week, we’re looking at five ways fleets can support employee well-being before a crisis, plus Holman’s expansion in Mexico, new one-day Fleet Forward passes, and why EV charging demand is outpacing infrastructure growth.
Read More →
Nexar-Nauto Merger Aims to Give Fleets Better Safety Intelligence Through Larger Driving Dataset
Stefan Heck tells Automotive Fleet that combining more than 10 billion miles of driving history with Nexar's AI models will give fleets deeper insights into driver risk and roadway conditions than either company could provide independently.
Read More →
Don't Wait for a Crisis: 5 Ways to Build Mental Health Into Your Fleet Safety Program
For Suicide Prevention Month, fleet and safety leaders have an opportunity to put mental health where it belongs: at the center of workplace safety.
Read More →
How Camera Data Can Strengthen a Fleet’s Insurance Renewal
Insights from a commercial insurance carrier and a broker show how fleets can turn video telematic data, driver coaching, and improved claims results into a stronger case at insurance renewal.
Read More →
The Safest Fleets Aren’t the Ones with the Most Technology
You’ve made the telematics investment. Here’s how to capture the other half of its value and build the safest fleet on the road.
Read More →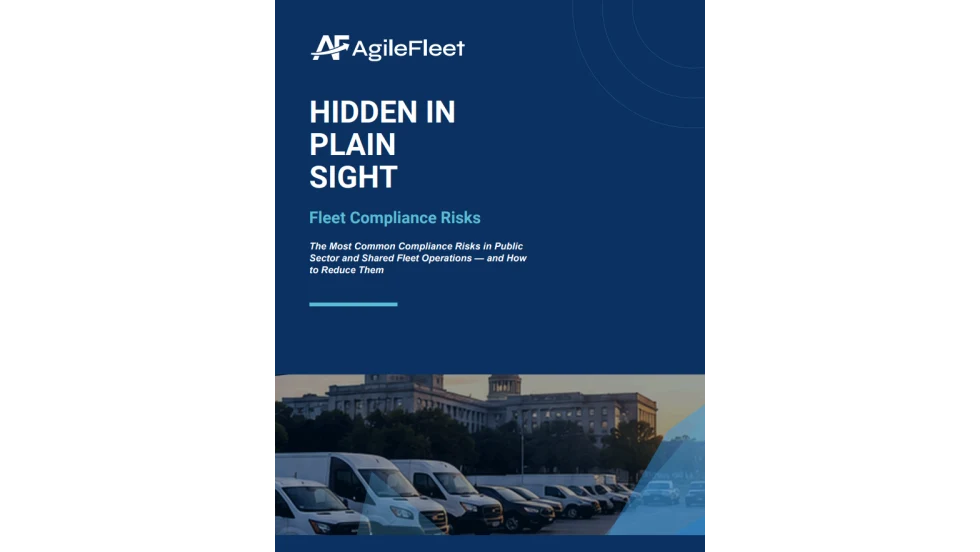
Hidden in Plain Sight: Fleet Compliance Risks
Fleet compliance isn't just about having policies — it's about consistently enforcing them. This practical guide reveals six hidden compliance risks common in public sector and shared fleet operations and outlines proven strategies to improve visibility, accountability, and audit readiness
Read More →