




NHTSA: Traffic Deaths Increase 7.2%
The federal government releases updated data for 2015, which indicates that one in three road fatalities involved drunk drivers or speeding.
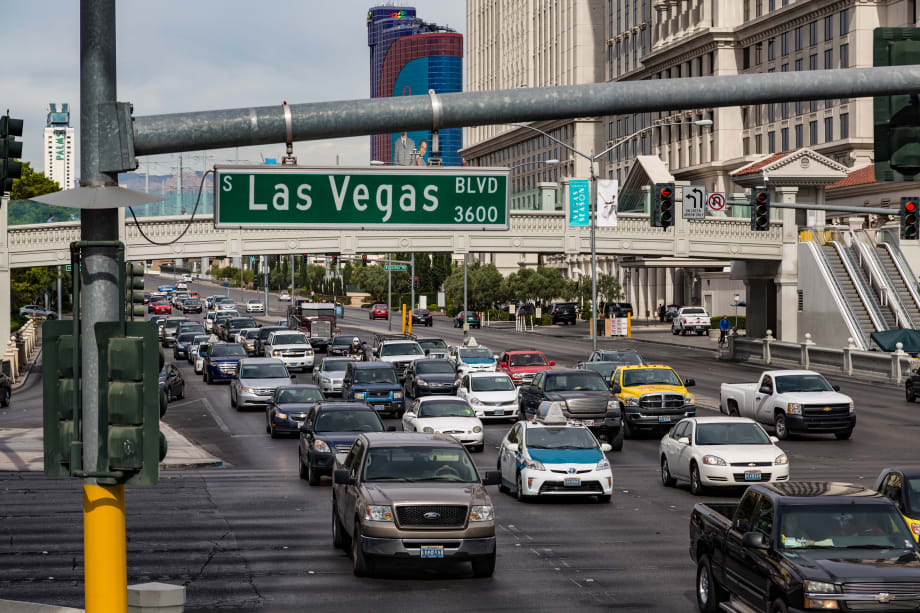
According to NHTSA, job growth and lower fuel prices were two factors that led to increased driving in 2015. Photo by Tony Webster of San Francisco via Flickr/Wikimedia Commons.
According to NHTSA, job growth and lower fuel prices were two factors that led to increased driving in 2015. Photo by Tony Webster of San Francisco via Flickr/Wikimedia Commons.
Last year saw a 7.2% increase in U.S. road fatalities compared to 2014, according to newly released updated figures from the National Highway Traffic Safety Administration.
The nation lost 35,092 people in traffic crashes in 2015, ending a five-decade trend of declining fatalities. Traffic deaths rose across nearly every segment of the population. The last single-year increase of this magnitude was in 1966, when fatalities rose 8.1% from the previous year, according to NHTSA.
Ten years ago, the number of traffic deaths was nearly 25% higher, with 42,708 fatalities reported nationwide in 2005. Since then, safety programs have helped lower the number of deaths by increasing seat belt use and reducing impaired driving. Vehicle improvements, including air bags and electronic stability control, have also contributed to reducing traffic fatalities.
“Despite decades of safety improvements, far too many people are killed on our nation’s roads every year,” said U.S. Transportation Secretary Anthony Foxx. “Solving this problem will take teamwork, so we’re issuing a call to action and asking researchers, safety experts, data scientists, and the public to analyze the fatality data and help find ways to prevent these tragedies.”
One key question is how to use statistical analysis to improve the targeting and effectiveness of behavioral-change marketing campaigns.
NHTSA will share its Fatality Analysis Reporting System (FARS) with safety partners, state and local officials, technologists, data scientists, and policy experts. And private sector partners using new data collection technologies will be offering access to unprecedented amounts of data and new visualizations tools.
According to NHTSA, job growth and low fuel prices were two factors that led to increased driving, including more leisure driving and driving by young people. More driving can contribute to higher fatality rates. In 2015, vehicle miles traveled increased 3.5% over 2014, the largest increase in nearly 25 years.
Pedestrian and bicyclist fatalities increased to a level not seen in 20 years. Motorcyclist deaths increased over 8%. NHTSA also noted human factors continued to contribute to the majority of crashes. Almost half of passenger vehicle occupants killed were not wearing seat belts.
Research also shows that almost one in three fatalities involved drunk drivers or speeding. One in 10 fatalities involved distraction.
“The data tell us that people die when they drive drunk, distracted, or drowsy, or if they are speeding or unbuckled,” said NHTSA Administrator Mark Rosekind. “While there have been enormous improvements in many of these areas, we need to find new solutions to end traffic fatalities.”
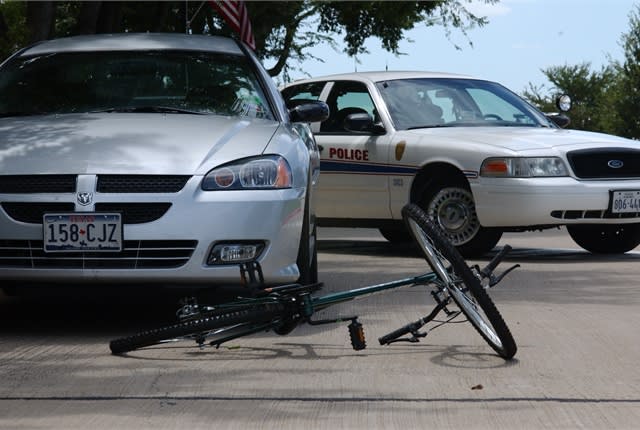
In 2015, collisions involving bicyclists climbed. In fact, pedal-cyclist fatalities increased by 89 (a 12.2% jump) and were at their highest level since 1995. Photo courtesy of NHTSA.
A number of private firms and universities are already committed to helping identify such solutions, NHTSA pointed out. They include:
StreetLight Data, a mobility analytics provider that transforms geospatial data from mobile devices into metrics that describe travel patterns. The company is providing free access to its data sets, which describe driving patterns in the vicinity of fatal crashes. Researchers and data scientists can request access to the data, which will be provided at no cost through the end of 2017.
CARTO, a leader in location intelligence using an analytical platform for geospatial data. The company is making FARS data available to the public through its platform and allowing researchers to combine data from other government and private-sector sources.
Mapbox, a mapping platform for developers. The company is developing interactive tools to better educate citizens about fatal crashes that occur around them in their daily lives. For example, Mapbox will launch an application that uses the fatality analysis data along with the firm’s directions service to show crashes along a commute route over the last five years, along with information about contributing factors such as alcohol or excessive speed.
Waze, a free, real-time traffic and navigation app. The company, part of Google, has partnered with the U.S. Department of Transportation to share data through the Connected Citizens Program. This free program helps municipal leaders harness real-time driver insights to improve congestion and make better informed planning decisions.
For more details about NHTSA's updated data on 2015 traffic fatalities, click here.
More Safety

Nexar-Nauto Merger Aims to Give Fleets Better Safety Intelligence Through Larger Driving Dataset
Stefan Heck tells Automotive Fleet that combining more than 10 billion miles of driving history with Nexar's AI models will give fleets deeper insights into driver risk and roadway conditions than either company could provide independently.
Read More →
Don't Wait for a Crisis: 5 Ways to Build Mental Health Into Your Fleet Safety Program
For Suicide Prevention Month, fleet and safety leaders have an opportunity to put mental health where it belongs: at the center of workplace safety.
Read More →
How Camera Data Can Strengthen a Fleet’s Insurance Renewal
Insights from a commercial insurance carrier and a broker show how fleets can turn video telematic data, driver coaching, and improved claims results into a stronger case at insurance renewal.
Read More →
The Safest Fleets Aren’t the Ones with the Most Technology
You’ve made the telematics investment. Here’s how to capture the other half of its value and build the safest fleet on the road.
Read More →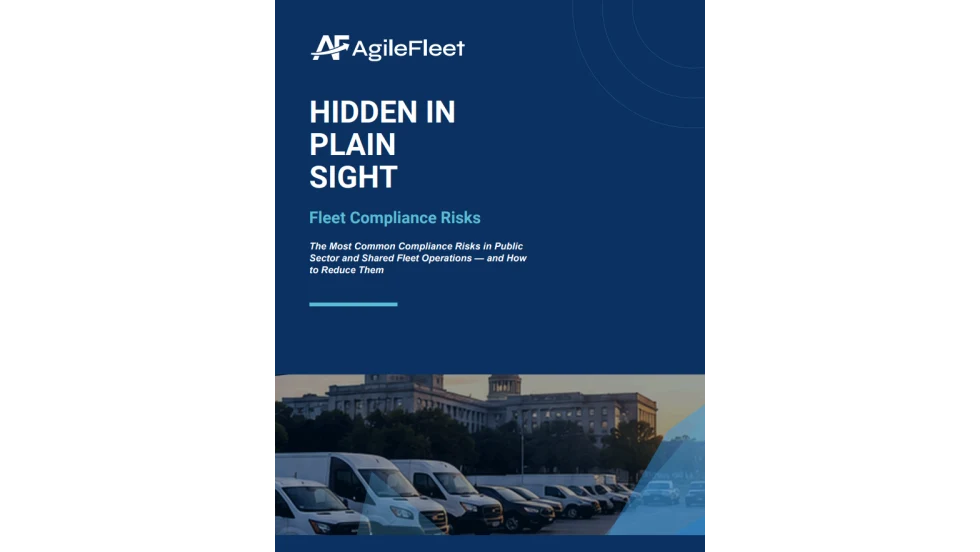
Hidden in Plain Sight: Fleet Compliance Risks
Fleet compliance isn't just about having policies — it's about consistently enforcing them. This practical guide reveals six hidden compliance risks common in public sector and shared fleet operations and outlines proven strategies to improve visibility, accountability, and audit readiness
Read More →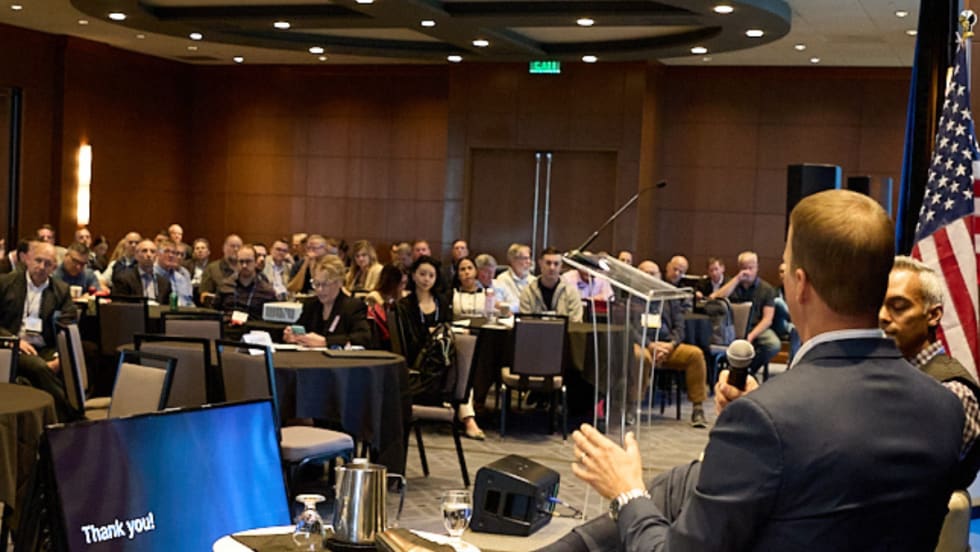
NETS Sets 2026 Fleet Safety Benchmark Conference for Indianapolis
The Sept. 15–17 program will feature fleet benchmarking data, case studies, emerging technologies, and implementation strategies while running alongside the NSC Safety Congress & Expo.
Read More →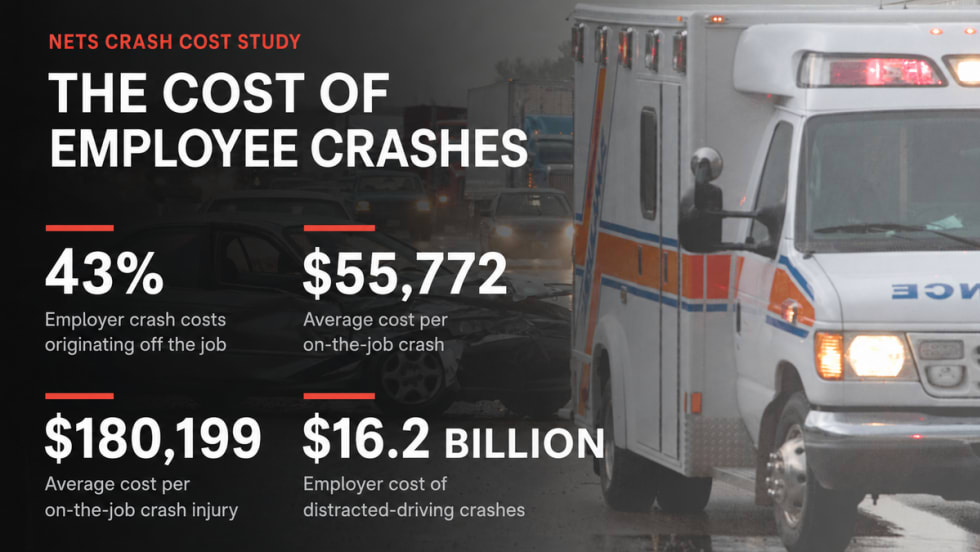
Off-the-Job Crashes Account for 43% of Employers’ $61.7 Billion Crash Burden
NETS quantifies costs dispersed across fleet, risk, HR, and other departments while providing new per-crash benchmarks for employers.
Read More →
Ram Recalls More Than 1.27 Million 1500 Pickups for Seat Belt Anchor Issue
The recall affects certain 2019-2026 Ram 1500 pickups that may have improperly attached second-row seat belt buckle anchors.
Read More →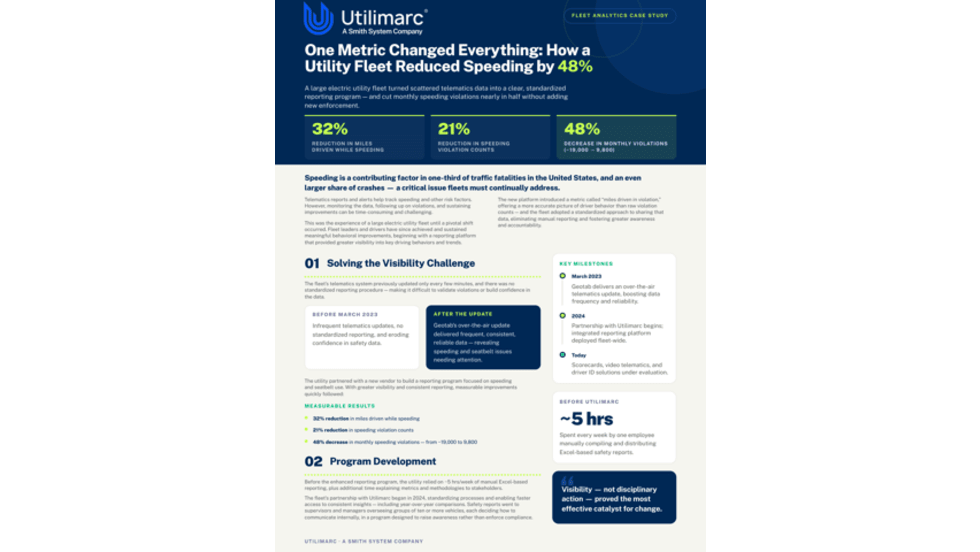
How Better Visibility Cut Speeding Violations by 48%
Fleet leaders don't need more data, they need clearer visibility into what the data is saying. This case study explores how one utility replaced speeding-event counts with a single metric — miles driven in violation — to strengthen safety and significantly reduce speeding violations.
Read More →
Operation Safe Driver Week: Why the Industry's Oldest Safety Campaign Still Matters to Fleets
A look at how a 2007 enforcement initiative became one of the most consequential weeks on the fleet safety calendar, and what it means for your drivers in 2026.
Read More →