

Want More? Adjusting Fleet Practices to Address High-Risk Driving
Lytx 'State of the Data' Report Reveals Risks, Coaching Opportunities for Fleets
The report is powered by 40 billion miles of new driving data from 2023 and can guide commercial fleet managers in factors to address in driver safety training programs.

Christy Grimes・Former Senior Editor
Speeding, distraction, not wearing a seat belt, and following too closely continue to top the list of risky behaviors in 2023.
Photo: Lytx
5 min to read
Lytx's 2024 'State of the Data' report provides insights into the top 10 behaviors contributing to risk, the riskiest cities for driving, the time of day with the highest risk for fleet drivers, and more.
“Road travel surged to record highs in 2023, and with more vehicles come more risks, as well as increased logistical complexity,” Lytx CEO and Chairman Brandon Nixon said. “It’s crystal clear that the need for safety and efficiency amid increasingly congested roadways has never been stronger. Despite an overall rise in road risk, our data indicates that companies that have implemented fleet safety programs are seeing the results across a number of success metrics – from lower claims costs and more efficient fuel use to improved collision avoidance.”
The report is powered by 40 billion miles of new driving data from 2023 and can guide commercial fleet managers in factors to address in driver safety training programs.
What Contributes to Roadway Risk?
Roadway risk captured by Lytx marched up 9.5% in 2023 from the previous year as traffic volume on U.S. roads swelled to a record 3.26 trillion miles, according to the Federal Highway Administration.
Lytx identified more than 18 million risky driving incidents in 2023.
Photo: Lytx
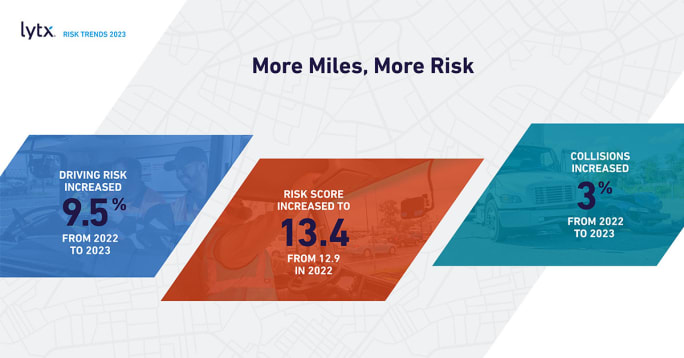
Correspondingly, Lytx identified more than 18 million risky driving incidents in 2023. Using the proprietary Lytx Risk Score, which calculates behavior averages across a variety of industries using learnings from 261 billion miles of driving data from Lytx’s global database, the report found:
Captured driving risk per vehicle increased 9.5%, from 2022 to 2023
Captured Lytx Risk Score per vehicle increased to 13.4 in 2023, from 12.9 in 2022
Collisions per vehicle increased 3%, from 2022 to 2023
The top 10 behaviors contributing to risk in the U.S. include:
Following distance (1-2 seconds)
Handheld device
No seat belt
Posted speed violation
Following distance (less than 1 second)
Incomplete stop
Food or drink
Failed to stop
Inattentive
Late response
Speeding, distraction, not wearing a seat belt, and following too closely continue to top the list of risky behaviors in 2023.
New to the top 10 list this year is incomplete stop. As roads become more congested, what once seemed like minor, habitual infractions are now resulting in more frequent —and severe — incidents.
What's Riskier: Mornings or Afternoons?
Among the report’s findings is a significant difference in risk between morning and afternoon commute hours. Despite similar congestion patterns, afternoon commute hours — 4:00 p.m. to 7:00 p.m. — were three times riskier than morning commute times — 5:00 a.m. to 8:00 a.m.
“The data around commute hours was one of the more interesting and surprising insights to emerge from this year’s analysis,” Lytx Client Intelligence Director Erin Baucum said. “This type of finding is extremely valuable for us as we build and refine our safety tools and programs, as well as for fleets to take into account as they plan their routes.”
The report also identified the riskiest day of the week to drive. In 2023, the highest collisions per vehicle in the U.S. occurred on Wednesdays, with Thursdays trailing closely behind. Alternatively, Sunday was the safest day of the week to drive, with Saturday as the second safest day.
What Are the Riskiest Cities and States for Driving?
For the third year in a row, in 2023, New York held the No. 1 spot as the nation’s riskiest driving city and was twice as risky as the next-riskiest city (Los Angeles).
Photo: Lytx
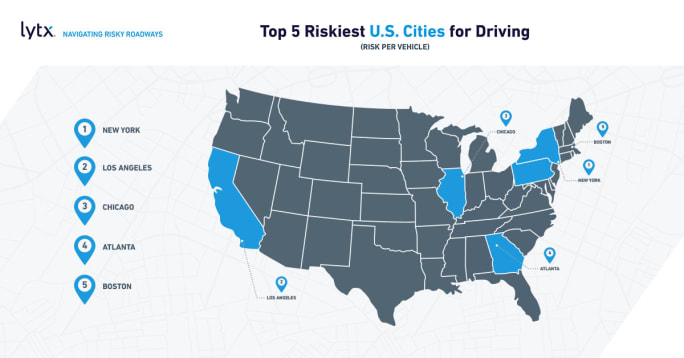
The chart below shows the top five riskiest U.S. cities for driving when calculated by risk per vehicle. The left column shows how the cities ranked in 2023, and the right column shows how they ranked in 2022.
2023 Ranking | 2022 Ranking |
| 1. New York City |
| 2. Philadelphia |
| 3. Los Angeles |
| 4. Chicago |
| 5. Dallas/Fort Worth |
For the third year in a row, in 2023, New York held the No. 1 spot as the nation’s riskiest driving city and was twice as risky as the next-riskiest city, which was Los Angeles for 2023.
Atlanta, which dropped to No. 7 in 2022, returned to the top five as the fourth riskiest city in 2023. Philadelphia, which ranked second in 2022, made the biggest improvement by moving down six spots to No. 8 in 2023.
In 2023, California has secured the top position as the nation’s riskiest state for driving for the third time in four years. More
Photo: Lytx
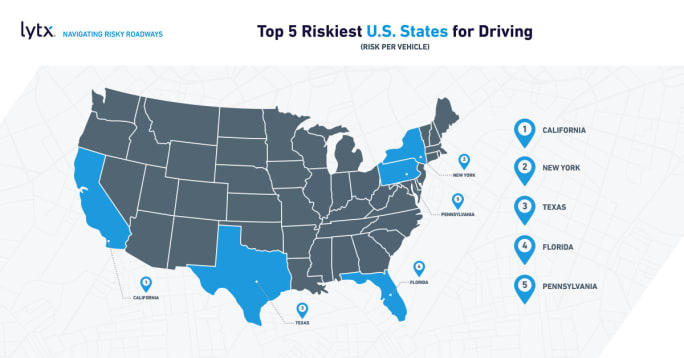
When measured by risk per vehicle, the top five riskiest states did not show much change between 2023 and 2022.
2023 Ranking | 2022 Ranking |
| 1. California |
| 2. Texas |
| 3. New York |
| 4. Florida |
| 5. Pennsylvania |
In 2023, California has secured the top position as the nation’s riskiest state for driving for the third time in four years. More than two times riskier than the fifth-ranked state (Pennsylvania), California continues to have the most-hazardous roads overall, likely due to its large population, numerous metropolitan areas, and high traffic volumes.
Of the five riskiest U.S. public roadways, only one is located in one of the top five riskiest states:
I-678 into JFK International Airport (Jamaica, New York)
I-10 into Phoenix Sky Harbor International Airport (Phoenix)
I-580 into Reno-Tahoe International Airport (Reno, Nevada)
N 3rd St. and E. Monroe St. near the Phoenix Convention Center (Phoenix)
N 3rd St. and E. Nationwide Blvd. near the Columbus Convention Center (Columbus, Ohio)
“Convention centers have joined airports as risky areas for collisions,” Lytx Client Intelligence Senior Analyist Kyle Warlick said. “The combination of congestion, frequent passenger drop-offs and pick-ups, and visitors who may be less familiar with the roads make these areas especially hazardous.”
Collision and Near-Collision Trends
The report revealed that near-collisions were up 97% from 2022 to 2023, and actual collisions were up 3% from 2022 to 2023
Although near collisions per mile were up 97% in 2023, collisions themselves were up only 3%. This suggests that, as roads got more congested, commercial drivers seemed to be getting better at avoiding collisions on a per mile basis through defensive driving skills and/or more attentive driving.
Across the board, all industries saw an increase in near collisions from 2022 to 2023. The biggest increases came from the Automotive (+226%), Concrete (+148%), and Emergency Medical Services (EMS) (+131%) industries.
Collision frequency and severity varied by industry in 2023.
Concrete (+49%) and Utilities (+14%) showed the biggest increases from 2022 to 2023, while Services (-8%) and EMS (-5%) saw the biggest decreases in collision frequency and severity in 2023.
More Safety

Nexar-Nauto Merger Aims to Give Fleets Better Safety Intelligence Through Larger Driving Dataset
Stefan Heck tells Automotive Fleet that combining more than 10 billion miles of driving history with Nexar's AI models will give fleets deeper insights into driver risk and roadway conditions than either company could provide independently.
Read More →
From Silos to Solutions: Relationship Management for Safer Fleets
From telematics adoption and driver accountability to policy consistency and risk mitigation, this episode breaks down what it really takes to build a safer fleet culture without slowing business down.
Read More →
IIHS Launches First Commercial Vehicle Safety Evaluations
The Insurance Institute for Highway Safety has begun evaluating heavy-duty pickups and cargo vans for driver protection. Which models earned top marks?
Read More →

Reducing Risk by Eliminating Phone Use Behind the Wheel
Hosted with the cofounder of Lifesaver Mobile, this episode addresses phone use behind the wheel and how to design a driving environment that actually helps prevents accidents.
Read More →
Sponsored•July 1, 2026
Cameras, Safety and Insurance: From Reactive Claims to Real-Time Prevention (Part 2 of 2)
Part Two: Commercial auto remains one of the most challenging and costly lines of coverage for fleet operators and insurers alike. Continue learning more about how to effectively address these issues from Onur Aksan, Enterprise Business Development Executive, Geotab
Read More →
How 5-Second Telematics Data Is Changing Fleet Safety
This episode connects with Steve Santostasi of Ford Pro and covers how a few seconds of data can make a difference in fleet safety.
Read More →
Managing Road Risk at Scale: Why Fleet Safety Needs a Data-Driven Framework
Insights from the FIA Road and Driver Safety Indexes reveal how to manage road risk on a larger scale.
Read More →
Stellantis Recalls 1.3 Million Jeep Vehicles Worldwide Over Fire Risk
Stellantis is recalling more than 1.3 million Jeep Wrangler and Gladiator models worldwide over a fire risk linked to power steering pump wiring.
Read More →
Coaching Is Not Training, Even When AI Is Doing It
AI-powered safety platforms can detect risky behaviors and deliver immediate feedback. But effective driver development still requires a foundation of training followed by coaching that reinforces those skills.
Read More →
How Emotions Behind the Wheel Can Affect Fleet Safety
During National Safety Month, fleets are encouraged to look beyond distracted driving and recognize how stress, fatigue, and emotional well-being influence driver performance and crash risk.
Read More →