


Related: How to Avoid Rear-End Collisions
Fleets Reduce Collisions 23% in Three Years
A recent Lytx data report that serves as an industry bellwether of fleet safety trends shows that although Lytx captured more than 14 million risky driving incidents within vehicle fleets in 2022, fleets continue to reduce bad habits.
May 31, 2023
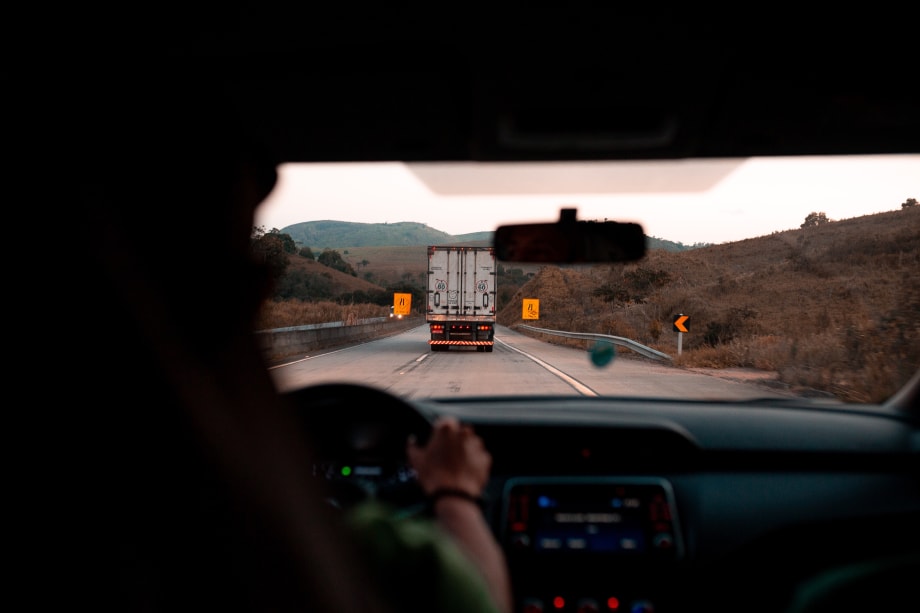
New data indicates that safety technology including dash cams are helping both automotive and truck fleets to reduce risky driver behaviors and crashes.
Photo: pexels.com/UHGO
3 min to read
In 2022, overall risky driving behaviors by fleet drivers improved 29% over 2019, according to Lytx’s fifth annual State of the Data report for trucks and vehicle fleets.
Collisions per 1 million miles driven also dropped, resulting in a 23% decrease from 2019 to 2022.
The report is based on over 36 billion miles of new driving data captured through Lytx’s DriveCam event recorders from real-world fleets that are Lytx customers. The latest data indicates drivers using Lytx technology and safety programs are experiencing long-term improvements in safe driving, notes the company.
Lytx captured more than 14 million risky driving incidents within vehicle fleets in 2022. However, several risky driving behaviors improved from 2021 to 2022. For example, the behavior that improved most was drivers failing to scan the roadway — dropping by 18%.
Better Driving Behavior
Other risky behaviors that ranked among the top five for greatest improvement include:
Staring blankly, which decreased 16%
Driving too fast for conditions, down 11%.
Seat belt compliance improved, too, with drivers unbelted on residential roads down 10%.
Drivers also experienced a decrease in veering off identifiable roadway, which dropped by 9%.
Noteworthy, while various driving habits improved over the last year, “driving too fast for conditions” was also the number one improved risky driving habit when comparing 2022 to 2020, down 52%. And it was the number two improved habit — down 74% — when comparing 2022 to 2019.
The report also explores where the riskiest driving takes place. New York City remained the number one riskiest driving city for the second consecutive year. Others that ranked among the top five riskiest driving cities include Philadelphia, which took second place, followed by Los Angeles, Chicago, and Dallas/ Fort Worth.
Identifying Collision Risks and Times
The data also spotlights factors that can impact the chances for a collision — such as specific times of day and particular days of the week.
For example, in 2022, the highest total number of collisions occurred during the daytime hours (6am- 4pm), with the most occurring at 11am. Alternatively, the highest collisions per vehicle (those on the road at each hour) occurred in the middle of the night (2am-6am), with 2am the most likely time for a collision.
As for days of the week, in 2022, the highest collisions per vehicle occurred on Tuesdays. Saturdays were the safest day of the week, with the lowest collisions per vehicle. Sundays were second lowest.
Other noteworthy findings from the report include the fact that most collisions — nearly 84% — occurred in clear weather. Some 13% of crashes occurred during rainy weather, but only about 3% happened in snowy weather and 0.1% in foggy conditions.
For fleets in rural areas, it’s important to know that animal strikes continue to rise — up 27% in 2022 as compared with 2019. In fact, hitting an animal accounted for nearly 30% of the collisions in clear weather and over 9% in rainy conditions. In contrast, fixed objects accounted for about 12% of accidents in clear conditions and 16% in rainy conditions.
More Safety

Sponsored•July 17, 2026
How Better Visibility Cut Speeding Violations by 48%
Fleet leaders don't need more data, they need clearer visibility into what the data is saying. This case study explores how one utility replaced speeding-event counts with a single metric — miles driven in violation — to strengthen safety and significantly reduce speeding violations.
Read More →
Operation Safe Driver Week: Why the Industry's Oldest Safety Campaign Still Matters to Fleets
A look at how a 2007 enforcement initiative became one of the most consequential weeks on the fleet safety calendar, and what it means for your drivers in 2026.
Read More →
Nexar-Nauto Merger Aims to Give Fleets Better Safety Intelligence Through Larger Driving Dataset
Stefan Heck tells Automotive Fleet that combining more than 10 billion miles of driving history with Nexar's AI models will give fleets deeper insights into driver risk and roadway conditions than either company could provide independently.
Read More →

Sponsored•July 2, 2026
From Silos to Solutions: Relationship Management for Safer Fleets
From telematics adoption and driver accountability to policy consistency and risk mitigation, this episode breaks down what it really takes to build a safer fleet culture without slowing business down.
Read More →
IIHS Launches First Commercial Vehicle Safety Evaluations
The Insurance Institute for Highway Safety has begun evaluating heavy-duty pickups and cargo vans for driver protection. Which models earned top marks?
Read More →
Reducing Risk by Eliminating Phone Use Behind the Wheel
Hosted with the cofounder of Lifesaver Mobile, this episode addresses phone use behind the wheel and how to design a driving environment that actually helps prevents accidents.
Read More →
Sponsored•July 1, 2026
Cameras, Safety and Insurance: From Reactive Claims to Real-Time Prevention (Part 2 of 2)
Part Two: Commercial auto remains one of the most challenging and costly lines of coverage for fleet operators and insurers alike. Continue learning more about how to effectively address these issues from Onur Aksan, Enterprise Business Development Executive, Geotab
Read More →
How 5-Second Telematics Data Is Changing Fleet Safety
This episode connects with Steve Santostasi of Ford Pro and covers how a few seconds of data can make a difference in fleet safety.
Read More →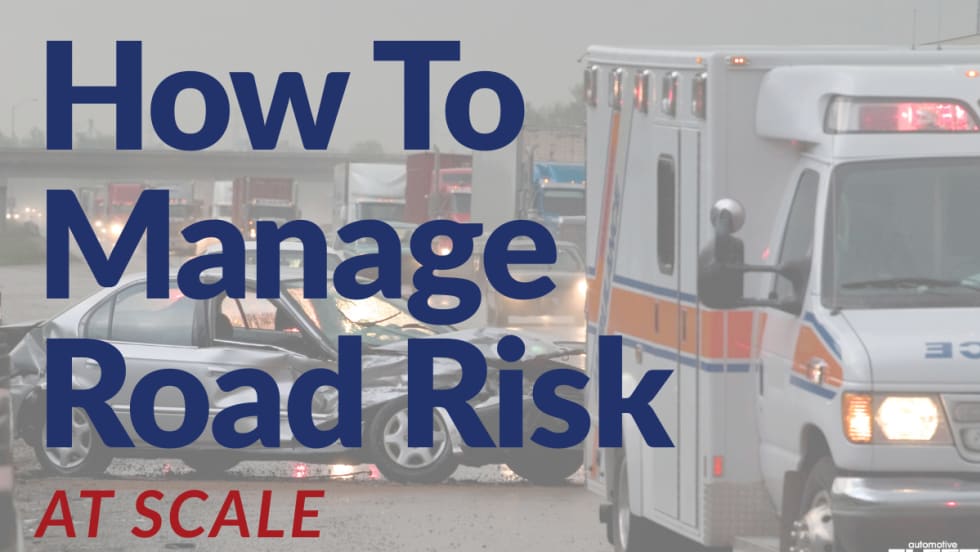
Managing Road Risk at Scale: Why Fleet Safety Needs a Data-Driven Framework
Insights from the FIA Road and Driver Safety Indexes reveal how to manage road risk on a larger scale.
Read More →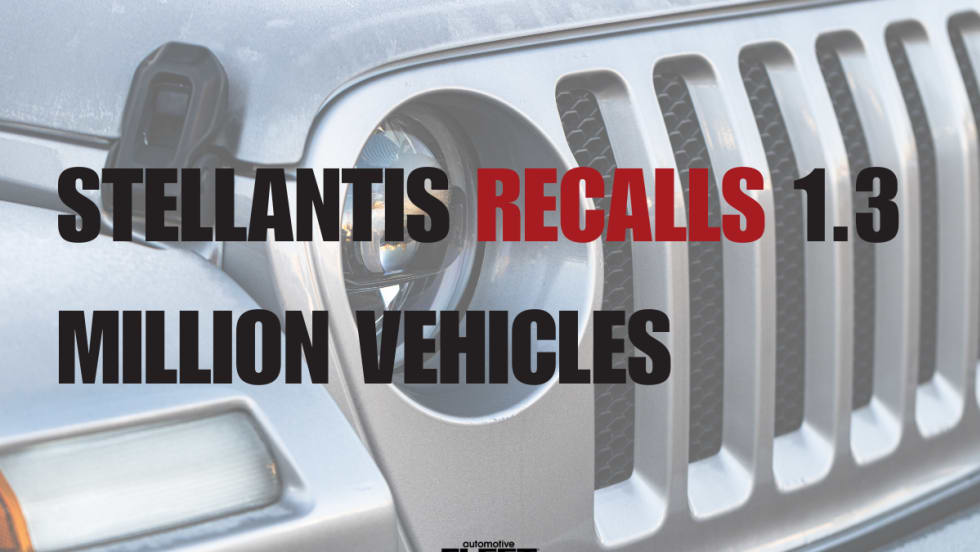
Stellantis Recalls 1.3 Million Jeep Vehicles Worldwide Over Fire Risk
Stellantis is recalling more than 1.3 million Jeep Wrangler and Gladiator models worldwide over a fire risk linked to power steering pump wiring.
Read More →