




IIHS Data Details Motor Vehicle Fatalities and Causes in 2011
The Insurance Institute for Highway Safety (IIHS) posted new data on motor vehicle crash fatalities from 2011. In 2011, a total of 32,367 people died in motor vehicle crashes, which is down 30% from 1975.
The Insurance Institute for Highway Safety (IIHS) posted new data on motor vehicle crash fatalities from 2011. In 2011, a total of 32,367 people died in motor vehicle crashes, which is down 30% from 1975.
The majority of these fatalities occurred in passenger vehicle collisions, which represented 66% of fatalities, a total of 21,347 in 2011. This figure is 3% less than in 2010. Out of this total, 59% of those killed were driving cars, 21% were driving pickup trucks, and 18% were driving SUVs.
In terms of the types of collisions where the highest number of fatalities occurred, frontal impacts accounted for 41% of passenger vehicle occupant deaths in 2011 and side impacts accounted for 25%. Rollover crashes made up 35% of passenger vehicle occupant deaths, of which 55% involved single-vehicle crashes and 13% involved multiple vehicles.
Inside the vehicle, 9% of occupant fatalities involved those sitting in the second or third rows, and out of that percentage, 26% was under the age of 13.
Out of the total number of passenger vehicle fatalities, 45% occurred in single-vehicle crashes and 55% occurred in collisions involving multiple vehicles. For vehicles other than cars, however, single-vehicle crashes accounted for 63% of SUV occupant deaths and 64% of pickup truck occupant deaths.
Men made up a disproportionate number of vehicle occupants killed in 2011, at 73%. People of both genders under the age of 25 made up 29% of fatalities.
Regarding large trucks (trucks not classified as passenger vehicles) rather than passenger vehicles, IIHS said 3,373 people died in collisions involving these vehicles in 2011. A total of 16% of these deaths involved truck occupants, 66% involved the occupants of cars and other passenger vehicles, and 16% involved pedestrians, bicyclists, or motorcyclists. The percentage of people who died who were involved in collisions with these vehicles was up 7% over 2009 (the lowest year of fatalities involving these vehicles on record since 1975), though the total number of deaths has dropped by 60% since the all-time high in 1979.
By truck type, 76% of deaths in large truck collisions in 2011 involved tractor-trailers and 25% involved single-unit trucks.
In collisions involving large trucks, 98% of occupants killed when a passenger vehicle and a large truck collide were in the passenger vehicle.
As for data related to when and where deaths involving large trucks occurred, in 2011, 59% occurred on major roads rather than on interstate highways and freeways, 31% did occur on interstates and highways, and 9% occurred on minor roads. Time-wise, 49% of deaths in collisions involving large trucks occurred between 6 a.m. and 3 p.m., which is greater than the 31% of crash deaths in vehicles other than large trucks.
Also, 15% of large truck crash deaths in 2011 occurred on Saturday and Sunday, which is much less than the 31% of crash deaths during this time period for other types of vehicles.
Two other statistics stood out, according to IIHS. Only 43% of fatally injured truck drivers were wearing safety belts in 2011 (compared with 45% of fatally injured passenger vehicle drivers). Safety belt use was unknown for 23% of fatally injured drivers of large trucks (compared with only 7% unknown for drivers of fatally injured passenger vehicles).
Also, drivers of large trucks killed in collisions typically have much lower blood alcohol levels than passenger vehicle drivers. Only 2% of fatally injured large truck drivers in 2011 had BACs at or above 0.08 percent, which is down 17% from 1982. By contrast, 33% of fatally injured passenger vehicle drivers had BACs at or above 0.08 percent in 2011. This number is down 51% since 1982.
More Safety

Nexar-Nauto Merger Aims to Give Fleets Better Safety Intelligence Through Larger Driving Dataset
Stefan Heck tells Automotive Fleet that combining more than 10 billion miles of driving history with Nexar's AI models will give fleets deeper insights into driver risk and roadway conditions than either company could provide independently.
Read More →
Don't Wait for a Crisis: 5 Ways to Build Mental Health Into Your Fleet Safety Program
For Suicide Prevention Month, fleet and safety leaders have an opportunity to put mental health where it belongs: at the center of workplace safety.
Read More →
How Camera Data Can Strengthen a Fleet’s Insurance Renewal
Insights from a commercial insurance carrier and a broker show how fleets can turn video telematic data, driver coaching, and improved claims results into a stronger case at insurance renewal.
Read More →
The Safest Fleets Aren’t the Ones with the Most Technology
You’ve made the telematics investment. Here’s how to capture the other half of its value and build the safest fleet on the road.
Read More →
Hidden in Plain Sight: Fleet Compliance Risks
Fleet compliance isn't just about having policies — it's about consistently enforcing them. This practical guide reveals six hidden compliance risks common in public sector and shared fleet operations and outlines proven strategies to improve visibility, accountability, and audit readiness
Read More →
NETS Sets 2026 Fleet Safety Benchmark Conference for Indianapolis
The Sept. 15–17 program will feature fleet benchmarking data, case studies, emerging technologies, and implementation strategies while running alongside the NSC Safety Congress & Expo.
Read More →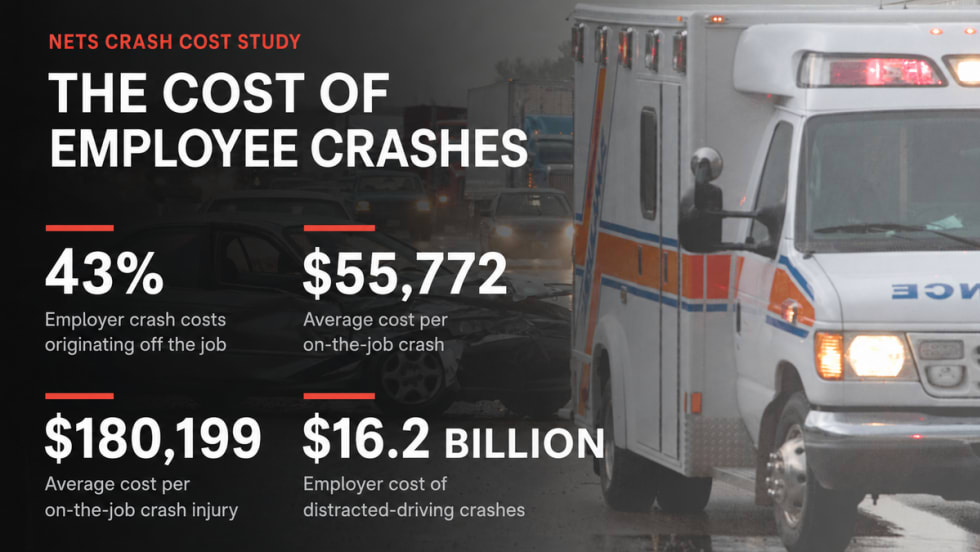
Off-the-Job Crashes Account for 43% of Employers’ $61.7 Billion Crash Burden
NETS quantifies costs dispersed across fleet, risk, HR, and other departments while providing new per-crash benchmarks for employers.
Read More →
Ram Recalls More Than 1.27 Million 1500 Pickups for Seat Belt Anchor Issue
The recall affects certain 2019-2026 Ram 1500 pickups that may have improperly attached second-row seat belt buckle anchors.
Read More →
How Better Visibility Cut Speeding Violations by 48%
Fleet leaders don't need more data, they need clearer visibility into what the data is saying. This case study explores how one utility replaced speeding-event counts with a single metric — miles driven in violation — to strengthen safety and significantly reduce speeding violations.
Read More →
Operation Safe Driver Week: Why the Industry's Oldest Safety Campaign Still Matters to Fleets
A look at how a 2007 enforcement initiative became one of the most consequential weeks on the fleet safety calendar, and what it means for your drivers in 2026.
Read More →