

Gasoline Prices Surge in Wake of Hurricanes
WASHINGTON, D.C. --- Propelled by temporary refinery outages resulting from hurricanes Gustav and Ike, the U.S. average retail price for regular gasoline increased for the first time in 10 weeks.
WASHINGTON, D.C. --- Propelled by temporary refinery outages resulting from hurricanes Gustav and Ike, the U.S. average retail price for regular gasoline increased for the first time in 10 weeks. The price shot up 18.7 cents to hit $3.835 per gallon, the Energy Department reported last week.
Despite the storm–related price surge, the price was still 27.9 cents below the all-time high set on July 7, noted the department's Energy Information Administration (EIA) in its weekly report released Wednesday, Sept. 17.
Regional price changes were mixed, going up east of the Rocky Mountains and dropping slightly in the West. The average price in the East Coast jumped 20 cents to $3.809 per gallon. In the Midwest, the price soared 31 cents to $3.946 per gallon, the highest price among the five regions. The price in the Gulf Coast shot up by 20.6 cents to $3.757 per gallon.
In contrast, the price in the Rocky Mountains fell for the eighth consecutive week, moving down 1.3 cents to $3.754 per gallon, now the lowest average price of any region. The price on the West Coast dropped another 4.3 cents, marking the 12th consecutive drop in that region. At $3.770 per gallon, the West Coast price fell below the national average price for the first time since Sept. 10, 2007. The price in California dropped 5.5 cents to $3.804 per gallon.
At the peak of preparations for Hurricane Gustav and later for Hurricane Ike, almost all Gulf of Mexico crude production was shut-in -- 1.3 million barrels per day, the EIA reported. Fifteen refineries were closed in Texas and Louisiana.
Another nine refineries reduced their crude oil throughput. As of Sept. 17, shut-in Gulf of Mexico crude production remained at 1.3 million barrels per day while 12 refineries remained closed and nine refineries were reducing runs, the EIA said.
As during Gustav, the U.S. federal government issued fuel waivers to help keep product markets as well supplied as possible. The Energy Department reported that the Strategic Petroleum Reserve began delivery of 439,000 barrels of emergency exchange oil to ConocoPhillips' Wood River refinery along the Capline pipeline system. The department also announced delivery of 239,000 barrels of emergency exchange oil to Placid Oil's Port Allen refinery along a Shell pipeline in Louisiana and 750,000 barrels to Marathon's Midwest refineries along the Capline pipeline system.
The most recent EIA data for the week ending Sept. 12, immediately before landfall of Hurricane Ike, show that U.S. crude oil refinery inputs averaged over 13.2 million barrels per day, down about 0.2 million barrels per day from the previous week's average. Gasoline production averaged about 8.3 million barrels per day, 0.1 million barrels per day less than the previous week, while distillate fuel production decreased 0.1 million barrels per day to 3.8 million barrels per day.
More Fuel
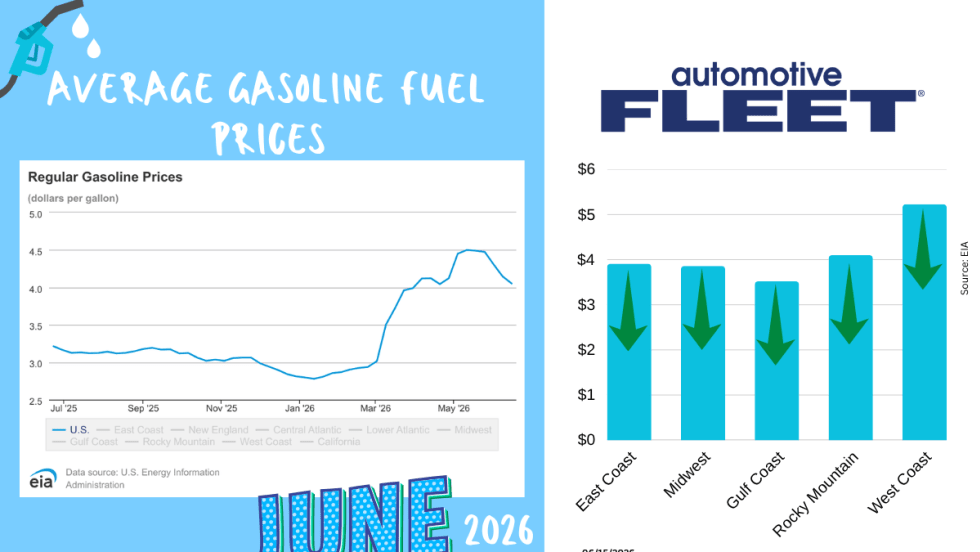
June Fuel Update: Prices Fall Below $4
Drivers are finally getting some relief at the pump. The national average gas price has dropped below $4 a gallon for the first time in months, with prices falling in 47 states as oil markets react to developments in U.S.-Iran negotiations.
Read More →
Study: How 2026's Gas Price Hikes Affect Different Vehicle Types
New data from iSeeCars reveals how rising fuel costs have affected different vehicle segments as gasoline prices climbed nearly 46% over the past four months.
Read More →Are You Tracking Your Fleet's True Total Cost of Ownership?
Bobit Business Media surveyed 190 fleet professionals and found that while most fleets are tracking costs, fragmented systems and data gaps are keeping true TCO visibility out of reach. With rising pressure to control spend in an increasingly volatile environment, the gap between what fleets think they know and what the data actually shows is wider than you might expect. See how your peers are managing costs today and where the industry still has room to improve.
Read More →
May Fuel Update: All Regions Experience Declines
Gas prices are finally easing in much of the country, but experts warn global tensions could quickly reverse the trend as the national average remains well above last month’s levels.
Read More →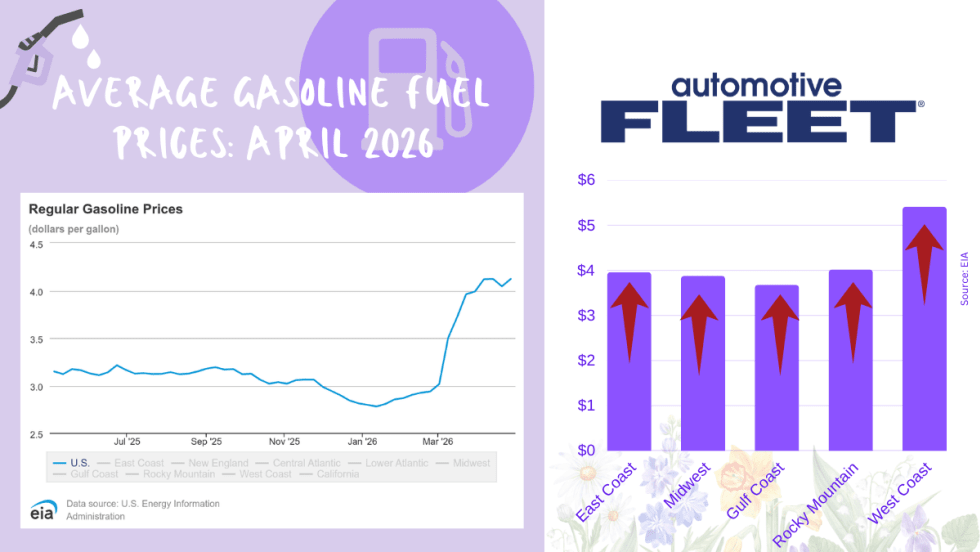
April Fuel Update: Prices Climb Above $4 as Spring Surge Accelerates
National average jumps to $4.04 per gallon, up sharply from last year, with West Coast prices topping $5 and further increases expected amid rising oil tensions.
Read More →
Tips from Fleet Managers on Saving Fuel Costs
Fleet leaders share practical strategies to reduce fuel spend through smarter policy, routing, and driver guidance.
Read More →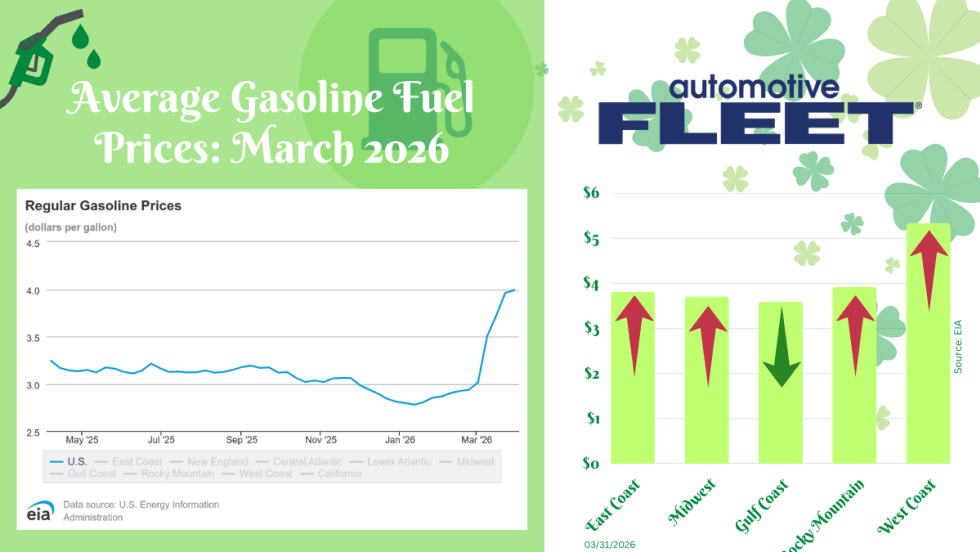
March Fuel Update: Prices Settle With a $4 Average
Fuel prices significantly slowed this week, but a $4 national average is still expected.
Read More →
Bob Adamsky on Fuel Volatility: “Don’t Panic — Have a Plan”
With oil prices rising again, AWP Safety’s fleet manager shares how to respond to rising fuel costs and how the right strategy can turn fuel spikes into cost-saving opportunities.
Read More →
Oil Market Turbulence Is Complicating Fleet Cost Planning
Rapid swings in crude oil prices driven by the conflict in the Middle East could create longer-term cost pressures for fleets, affecting fuel prices, supply chains, and vehicle strategy, says NTEA’s Andrew Wrobel.
Read More →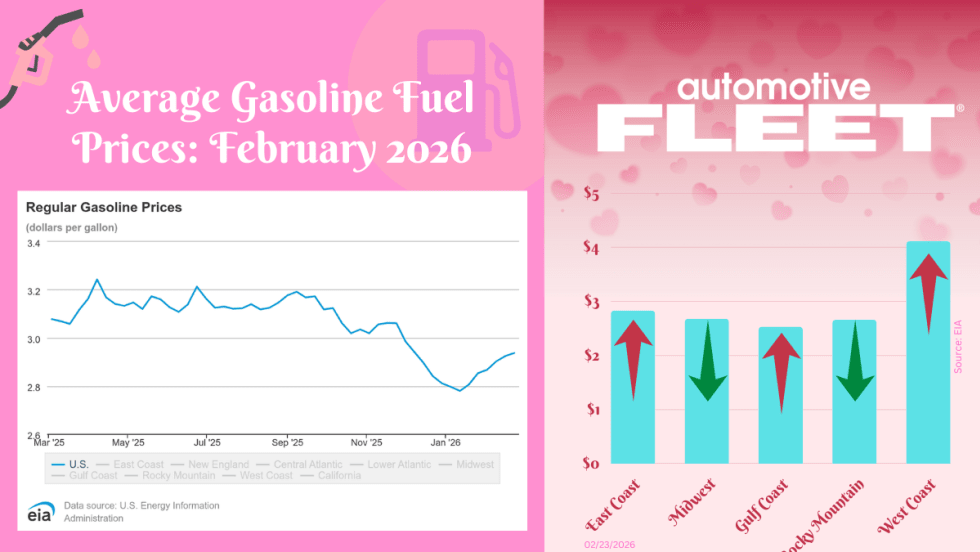
February Fuel Update: Prices Inch Higher for Third Week in a Row
The final February fuel update reveals prices continuing to inch higher for the third week in a row.
Read More →