

EPA Proposes Changes to How Fuel Economy Ratings are Calculated
DETROIT – For the first time in 20 years, the Environmental Protection Agency (EPA) has unveiled a proposal to change the way it calculates fuel economy ratings for cars and trucks so that automobile window stickers reflect real-world driving.
DETROIT – For the first time in 20 years, the Environmental Protection Agency (EPA) has unveiled a proposal to change the way it calculates fuel economy ratings for cars and trucks so that automobile window stickers reflect real-world driving, according to the New York Times. Fuel economy estimates currently take into account only how vehicles perform, on average, under city driving conditions and on the highway. The new estimates will use much more information to make the calculations. For example, the EPA will now use data from tests representing real-world, conditions. These include driving at high speeds and with rapid acceleration, when air conditioning is in use, in cold temperatures, on steeply graded roads, and in windy conditions, as well as taking into account whether tires are properly inflated and what kind of fuel that is in the gas tank. As a result of these new ratings, the fuel economy estimates for city driving would drop by 10 to 20 percent, while fuel economy estimates for highway driving would fall by 5 to 15 percent. The EPA estimates that fuel economy for hybrids would result in a 20 to 30 percent drop, although estimates for highway driving would drop the same 5 to 15 percent as gasoline-powered automobiles. If adopted, the proposal will take effect beginning with vehicles built for the 2008-model year, which go on sale in 2007. The EPA will take comments from the public, the industry, and other groups on the changes for the next 60 days. Also set to change, if the proposal is adopted, is the appearance of window stickers themselves. The agency is considering four different designs for the stickers and is expected to choose one later, according to the Times report.
More Fuel
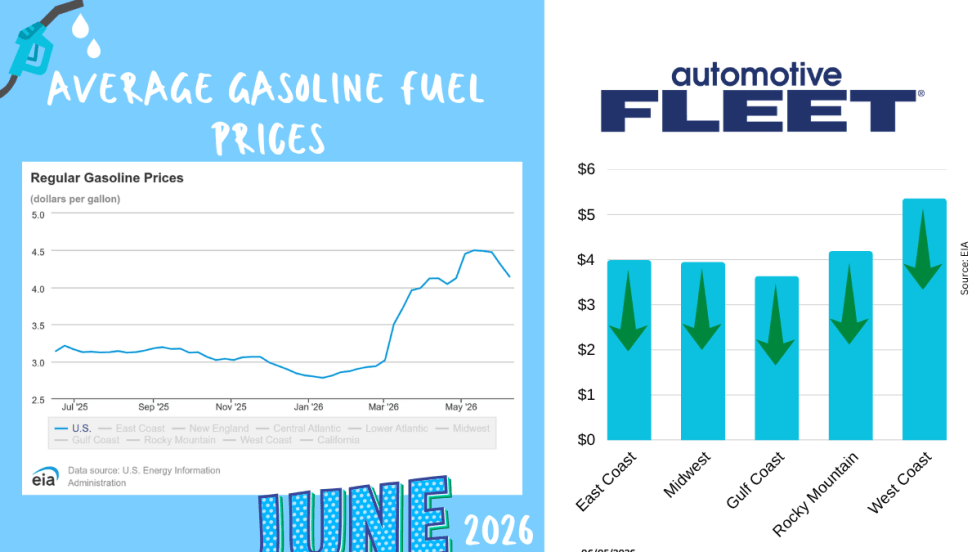
June Fuel Update: Prices Continue to Fall
While prices have continued to decline for four straight weeks, the next weeks don't look as promising.
Read More →
Study: How 2026's Gas Price Hikes Affect Different Vehicle Types
New data from iSeeCars reveals how rising fuel costs have affected different vehicle segments as gasoline prices climbed nearly 46% over the past four months.
Read More →Are You Tracking Your Fleet's True Total Cost of Ownership?
Bobit Business Media surveyed 190 fleet professionals and found that while most fleets are tracking costs, fragmented systems and data gaps are keeping true TCO visibility out of reach. With rising pressure to control spend in an increasingly volatile environment, the gap between what fleets think they know and what the data actually shows is wider than you might expect. See how your peers are managing costs today and where the industry still has room to improve.
Read More →
May Fuel Update: All Regions Experience Declines
Gas prices are finally easing in much of the country, but experts warn global tensions could quickly reverse the trend as the national average remains well above last month’s levels.
Read More →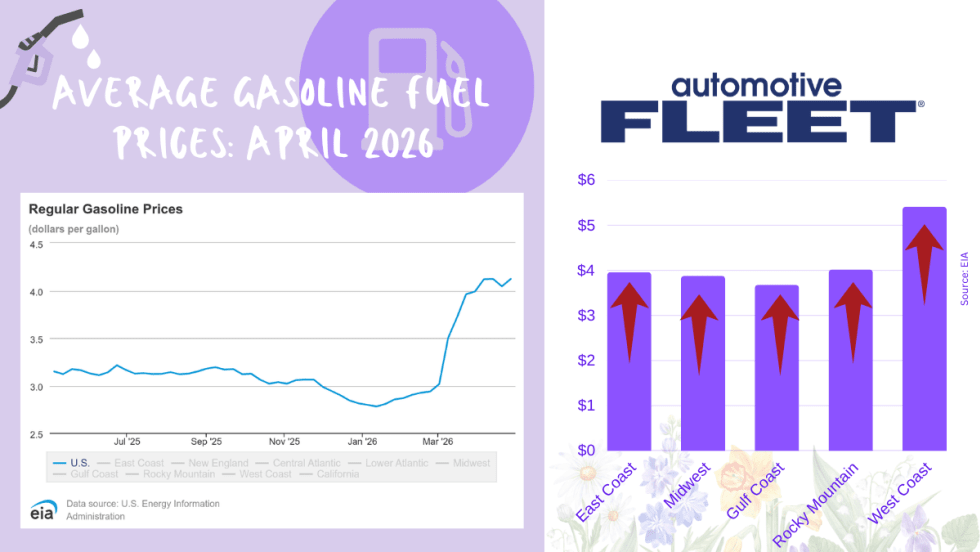
April Fuel Update: Prices Climb Above $4 as Spring Surge Accelerates
National average jumps to $4.04 per gallon, up sharply from last year, with West Coast prices topping $5 and further increases expected amid rising oil tensions.
Read More →
Tips from Fleet Managers on Saving Fuel Costs
Fleet leaders share practical strategies to reduce fuel spend through smarter policy, routing, and driver guidance.
Read More →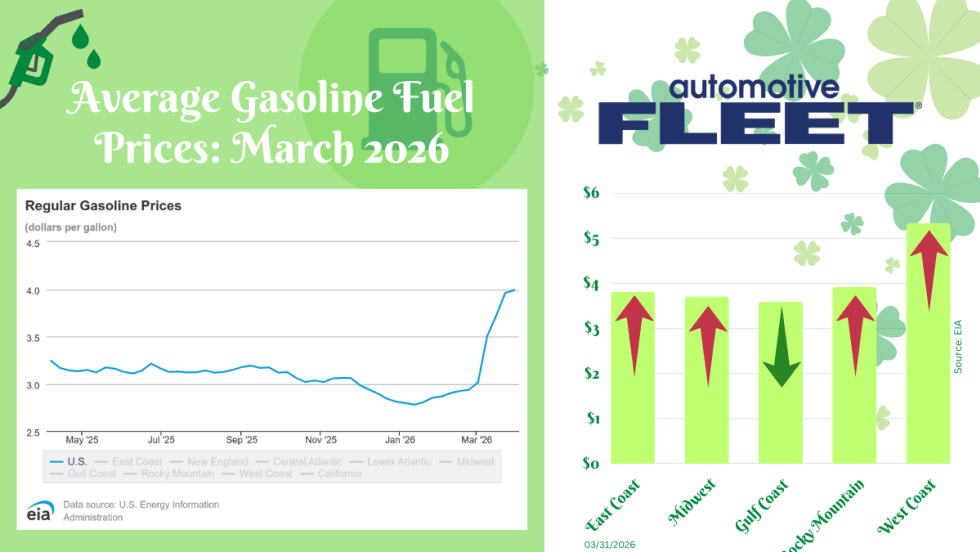
March Fuel Update: Prices Settle With a $4 Average
Fuel prices significantly slowed this week, but a $4 national average is still expected.
Read More →
Bob Adamsky on Fuel Volatility: “Don’t Panic — Have a Plan”
With oil prices rising again, AWP Safety’s fleet manager shares how to respond to rising fuel costs and how the right strategy can turn fuel spikes into cost-saving opportunities.
Read More →
Oil Market Turbulence Is Complicating Fleet Cost Planning
Rapid swings in crude oil prices driven by the conflict in the Middle East could create longer-term cost pressures for fleets, affecting fuel prices, supply chains, and vehicle strategy, says NTEA’s Andrew Wrobel.
Read More →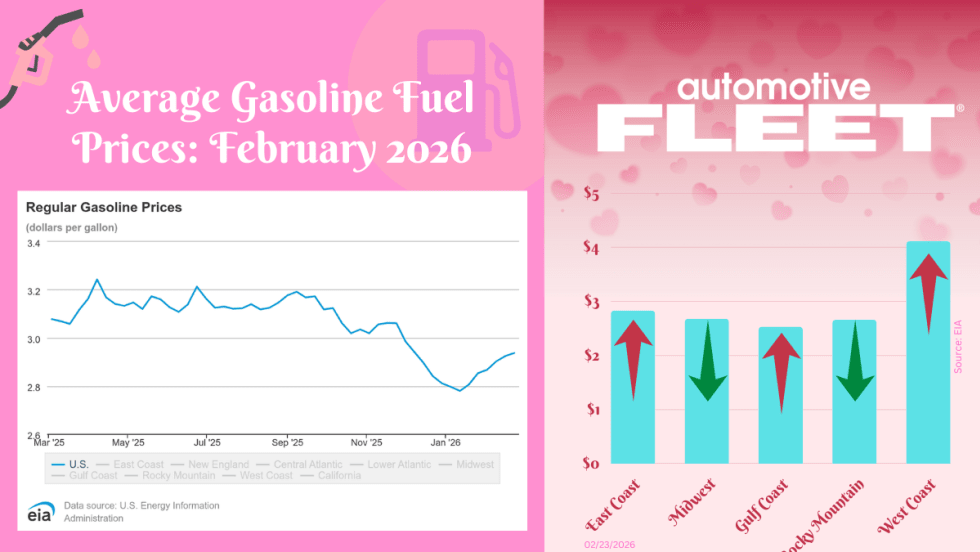
February Fuel Update: Prices Inch Higher for Third Week in a Row
The final February fuel update reveals prices continuing to inch higher for the third week in a row.
Read More →