

Edmunds.com Study: Some Hybrid Vehicles Make Financial Sense
SANTA MONICA, Calif. —- Edmunds.com's latest hybrid study shows that despite higher sales prices, purchasing some -— though not all -— of today's hybrids can make good financial sense.
SANTA MONICA, Calif. — Edmunds.com’s latest hybrid study shows that despite higher sales prices, purchasing some — though not all -— of today's hybrids can make good financial sense. For the latest installment of its Fuel Economy Guide, Edmunds.com compared the sales prices and annual gas expenses of hybrid vehicles and their non-hybrid counterparts. "Our study revealed that high gas prices and generous tax credits now offset the high sales prices of some hybrids, assuming owners keep their hybrids for a few years," said Alex Rosten, manager of pricing and market analysis for Edmunds.com. Edmunds.com's study indicates that the higher purchase price is completely recovered for the Ford Escape Hybrid and Toyota Prius within three years of ownership, while buyers of the Honda Civic Hybrid, Saturn VUE Green Line and Toyota Camry Hybrid reach break-even within six years of ownership, in each case assuming the vehicle is driven 15,000 miles per year. Full tax credits are only provided to consumers until shortly after each manufacturer has sold 60,000 hybrids. After that threshold is reached, the tax credit gets cut in half. For Toyota and Lexus buyers, that threshold has been reached -— so anyone who buys a Toyota or Lexus hybrid after September 30, 2006 will only qualify for half the tax credit. The credit for these models will drop to 25% in April 2007 and then to zero in October 2007. "If you're in the market for a hybrid, right now is the best time to buy," said Joanne Helperin, senior editor of Edmunds.com's Fuel Economy Guide. "It will take buyers much longer to break-even if their tax credit is halved." This hybrid study assumed the vehicles were sold at the Edmunds.com True Market Value price and achieved the Environmental Protection Agency's recorded mileage for combined city and highway driving. The 2006 federal tax credit was applied when appropriate. Figures were calculated based on the assumption that one gallon of gasoline costs $3.00 (which was the nation's average price for regular unleaded fuel on Aug. 14, 2006). For more information about this study, visit http://www.edmunds.com/advice/fueleconomy/articles/116513/article.html
More Fuel
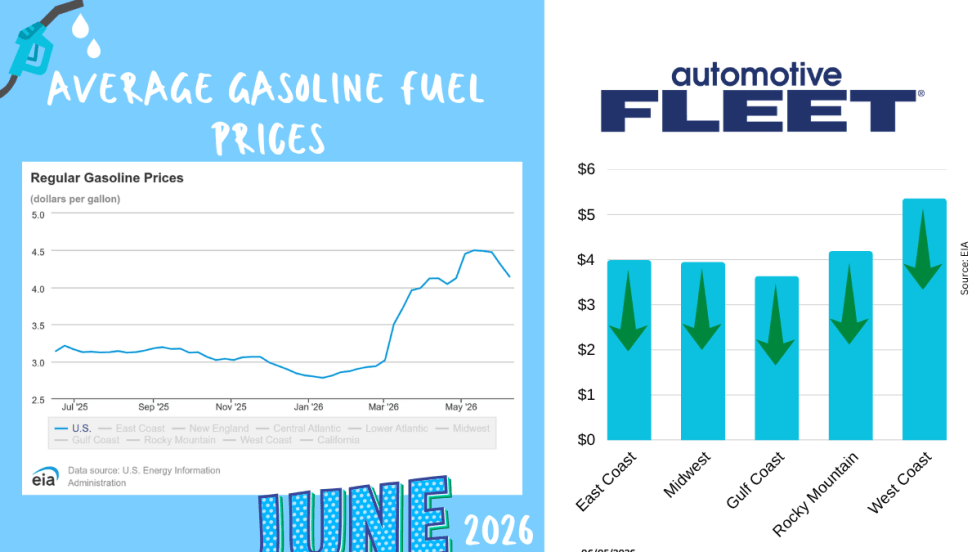
June Fuel Update: Prices Continue to Fall
While prices have continued to decline for four straight weeks, the next weeks don't look as promising.
Read More →
Study: How 2026's Gas Price Hikes Affect Different Vehicle Types
New data from iSeeCars reveals how rising fuel costs have affected different vehicle segments as gasoline prices climbed nearly 46% over the past four months.
Read More →Are You Tracking Your Fleet's True Total Cost of Ownership?
Bobit Business Media surveyed 190 fleet professionals and found that while most fleets are tracking costs, fragmented systems and data gaps are keeping true TCO visibility out of reach. With rising pressure to control spend in an increasingly volatile environment, the gap between what fleets think they know and what the data actually shows is wider than you might expect. See how your peers are managing costs today and where the industry still has room to improve.
Read More →
May Fuel Update: All Regions Experience Declines
Gas prices are finally easing in much of the country, but experts warn global tensions could quickly reverse the trend as the national average remains well above last month’s levels.
Read More →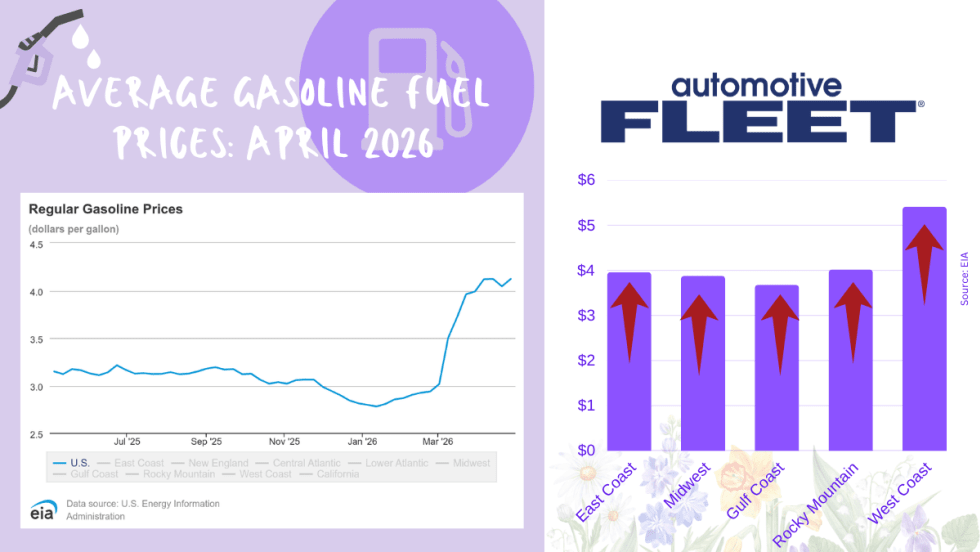
April Fuel Update: Prices Climb Above $4 as Spring Surge Accelerates
National average jumps to $4.04 per gallon, up sharply from last year, with West Coast prices topping $5 and further increases expected amid rising oil tensions.
Read More →
Tips from Fleet Managers on Saving Fuel Costs
Fleet leaders share practical strategies to reduce fuel spend through smarter policy, routing, and driver guidance.
Read More →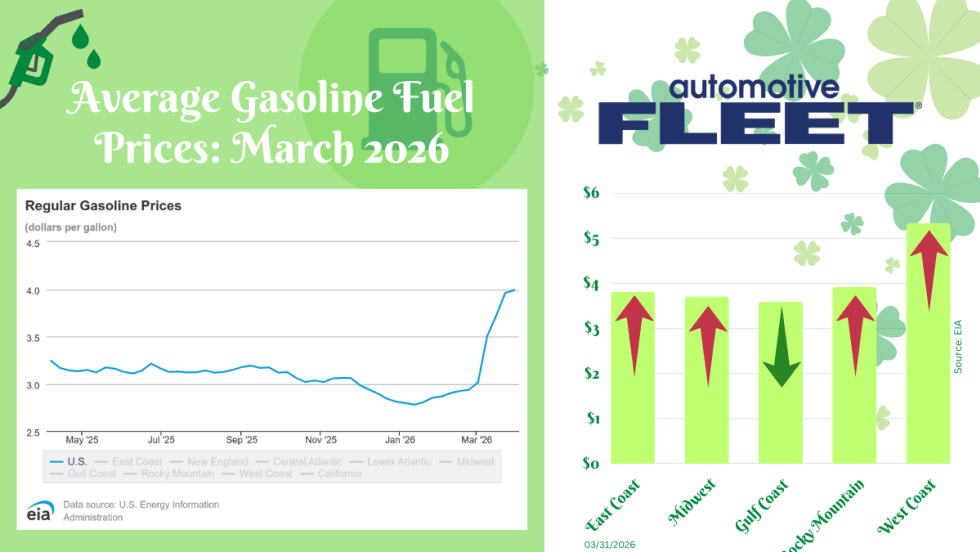
March Fuel Update: Prices Settle With a $4 Average
Fuel prices significantly slowed this week, but a $4 national average is still expected.
Read More →
Bob Adamsky on Fuel Volatility: “Don’t Panic — Have a Plan”
With oil prices rising again, AWP Safety’s fleet manager shares how to respond to rising fuel costs and how the right strategy can turn fuel spikes into cost-saving opportunities.
Read More →
Oil Market Turbulence Is Complicating Fleet Cost Planning
Rapid swings in crude oil prices driven by the conflict in the Middle East could create longer-term cost pressures for fleets, affecting fuel prices, supply chains, and vehicle strategy, says NTEA’s Andrew Wrobel.
Read More →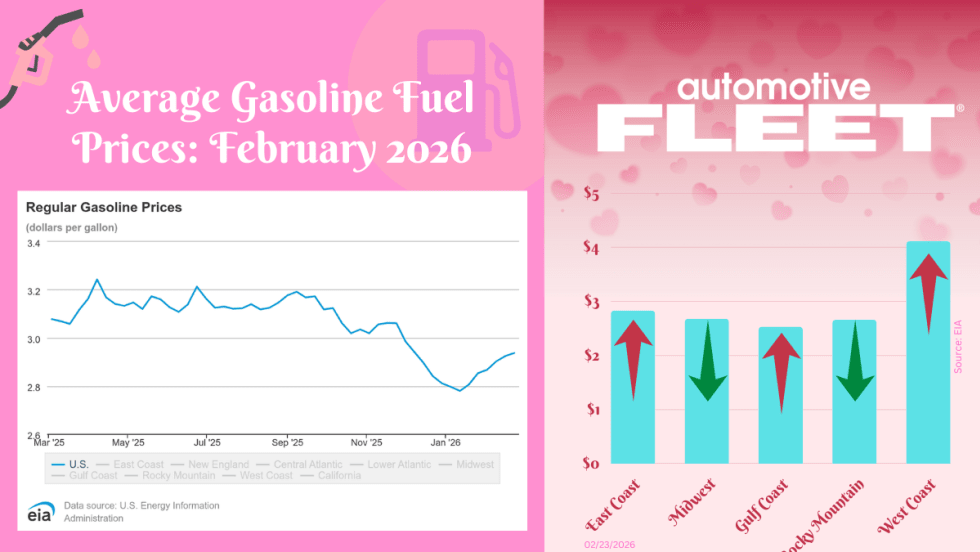
February Fuel Update: Prices Inch Higher for Third Week in a Row
The final February fuel update reveals prices continuing to inch higher for the third week in a row.
Read More →