

Decline in Gasoline Consumption Projected to be 3.4 Percent in '08
WASHINGTON, D.C. --- Motor gasoline consumption in 2008 is projected to decline 320,000 barrels per day (bbl/d), or 3.4 percent, from 2007, according to the Short-Term Energy Outlook, released Dec. 9 by the Energy Information Administration (EIA).
WASHINGTON, D.C. --- Motor gasoline consumption in 2008 is projected to decline 320,000 barrels per day (bbl/d), or 3.4 percent, from 2007, according to the Short-Term Energy Outlook, released Dec. 9 by the Energy Information Administration (EIA).
For 2009, the Outlook predicts an additional gasoline consumption decline of about 50,000 barrels per day, or 0.6 percent, from 2008. "Should this projection pan out, it would be the steepest two-year (2008-09) consecutive decline in motor gasoline consumption since 1979-80," EIA said. "Taking account of the rise in average ethanol content of motor gasoline, estimated to be 635,000 bbl/d in 2008 and 675,000 bbl/d in 2009, the decline in consumption of petroleum-based gasoline components is even larger."
EIA attributed the current decline in consumption to two factors: consumer reaction to recent historically high retail gasoline prices ($4.11 per gallon for regular grade fuel by the second week of July) and the very weak economy. EIA pointed out that today's decline shares some similarities, but is somewhat different, from the sharp decline seen almost three decades ago.
"Although there have been several previous incidences of price- and recession-related declines in motor gasoline consumption, the one that most closely resembles the current set of conditions is the 1979-82 period, during which the U.S. economy experienced a mild downturn (1980) and a full-fledged recession (1981-82)," EIA explained. "In 1980, motor gasoline consumption declined by the largest volume (455,000 barrels per day) and proportion (6.5 percent)."
When real costs per mile stopped increasing in 1981, vehicle miles traveled resumed its growth, buoyed by a temporary bounce in real gross domestic product. "In addition, both 1982 and 2009 (projected) registered growth in highway travel as a result of sizable declines in fuel costs despite the declines in real GDP." EIA said.
But there are structural differences in consumer responses to gasoline price changes between the two periods. In 1979-80, real per-mile fuel costs increased an average of more than 15 percent, and highway travel declined by an average of 1 percent per year despite an average annual GDP growth of 1.5 percent. In contrast, real per-mile fuel costs in 2007-08 increased an average of only 10 percent per year, somewhat less than that in 1979-80. Nonetheless, highway travel declined by an average of more than 2 percent per year -- two times that of the 1979-80 decline -- despite an average GDP growth similar to that of 1979-80.
"This result suggests that, in the second period, the rapidity of the increase in prices to record levels resulted in a larger shift in consumer behavior," EIA said. "The cumulative effect of previous run-ups in the retail price to $3 per gallon in 2006 and 2007 may have also contributed. By the time retail gasoline prices peaked above $4 per gallon, many consumers had begun to feel that $3 per gallon was the new "floor" price that could be expected in the future. Recent motor gasoline volume data from the Energy Information Administration and highway travel data from the Federal Highway Administration suggest that the precipitous decline in gasoline prices by about $2.40 per gallon from the July 2008 peak has yet to revive consumer demand for highway travel, and hence for motor gasoline, even after accounting for the current economic downturn."
Another difference between the two periods is the fuel-efficiency (MPG) response to the increase in fuel prices. During the first period, fleet-wide fuel efficiencies grew by an average of 3.9 percent per year. As a result there was a major gasoline consumption decline during the first two years and a continuing overall decline during the second two years, despite substantial increases in vehicle miles traveled. Because fleet-wide efficiencies in the current period are almost twice that of those prior going into the 1979-82 period, the impact of switching to more fuel-efficient vehicles is more limited.
"In addition, the increasing use of ethanol in the motor gasoline pool has lowered the average per-gallon energy content of the fuel, which increases the volume of fuel required per mile of travel at any given level of vehicle efficiency." EIA said. "When real costs per mile stopped increasing in 1981, vehicle miles traveled resumed its growth, buoyed by a temporary bounce in real gross domestic product."
More Fuel

Bob Adamsky on Fuel Volatility: "Don't Panic, Have a Plan."
When it comes to up and down fuel prices, Adamsky has a message for fleets: “Don’t panic.”
Read More →
How Fleets Can Gain Control of Non-Fuel Spend
Fuel often gets the spotlight, but non-fuel expenses can have a major impact on fleet costs. Ramel Lindsay of U.S. Bank Voyager discusses how fleets can gain better visibility and control over these often-overlooked expenditures.
Read More →
Fuel is Just the Start: How Middle East Tensions are Driving Up Fleet Maintenance Costs
The Middle East conflict is doing more than pushing up fuel prices. It’s also raising the cost of key maintenance products your fleet depends on, from motor oil to tires to windshield wipers. Here’s what you need to know about this budget-busting situation.
Read More →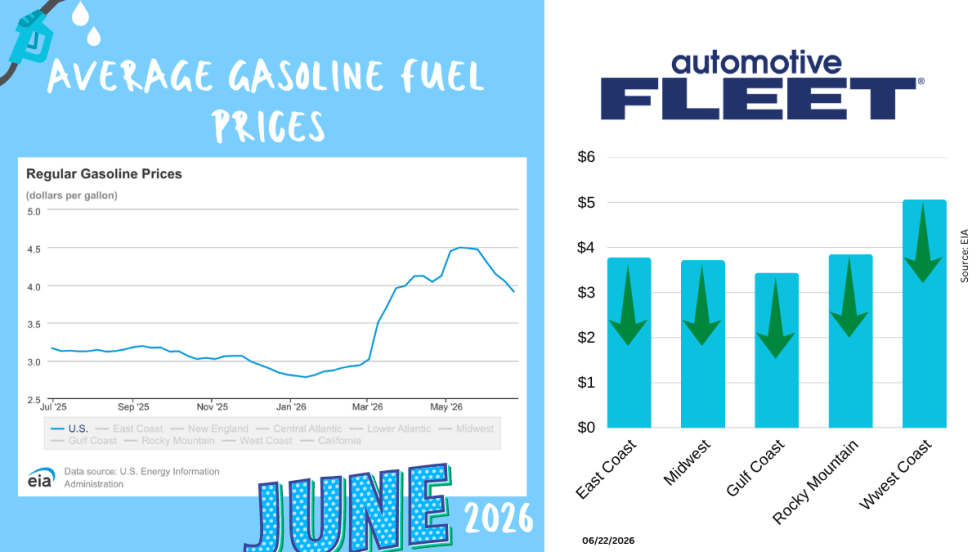
June Fuel Update: Prices Fall Below $4
Drivers are finally getting some relief at the pump. The national average gas price has dropped below $4 a gallon for the first time in months, with prices falling in 47 states as oil markets react to developments in U.S.-Iran negotiations.
Read More →
Study: How 2026's Gas Price Hikes Affect Different Vehicle Types
New data from iSeeCars reveals how rising fuel costs have affected different vehicle segments as gasoline prices climbed nearly 46% over the past four months.
Read More →Are You Tracking Your Fleet's True Total Cost of Ownership?
Bobit Business Media surveyed 190 fleet professionals and found that while most fleets are tracking costs, fragmented systems and data gaps are keeping true TCO visibility out of reach. With rising pressure to control spend in an increasingly volatile environment, the gap between what fleets think they know and what the data actually shows is wider than you might expect. See how your peers are managing costs today and where the industry still has room to improve.
Read More →
May Fuel Update: All Regions Experience Declines
Gas prices are finally easing in much of the country, but experts warn global tensions could quickly reverse the trend as the national average remains well above last month’s levels.
Read More →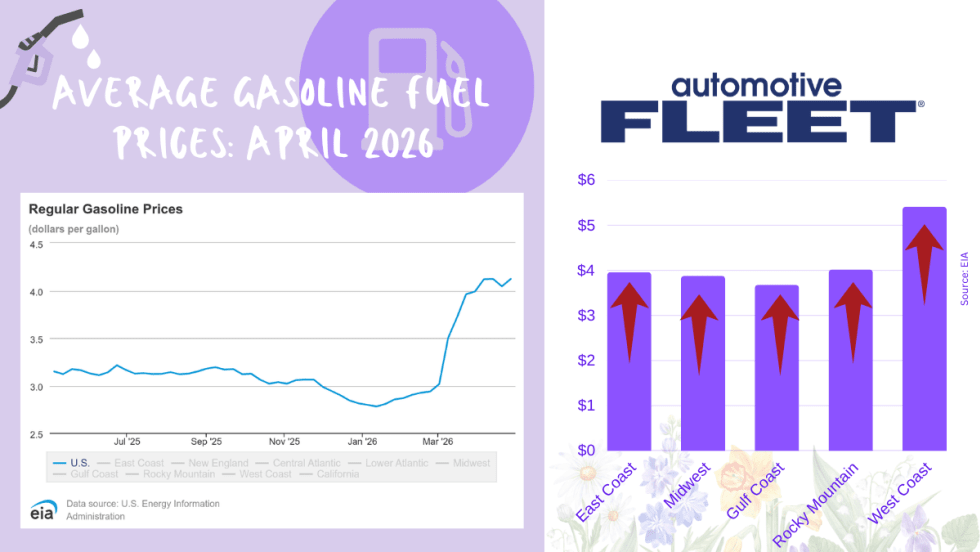
April Fuel Update: Prices Climb Above $4 as Spring Surge Accelerates
National average jumps to $4.04 per gallon, up sharply from last year, with West Coast prices topping $5 and further increases expected amid rising oil tensions.
Read More →
Tips from Fleet Managers on Saving Fuel Costs
Fleet leaders share practical strategies to reduce fuel spend through smarter policy, routing, and driver guidance.
Read More →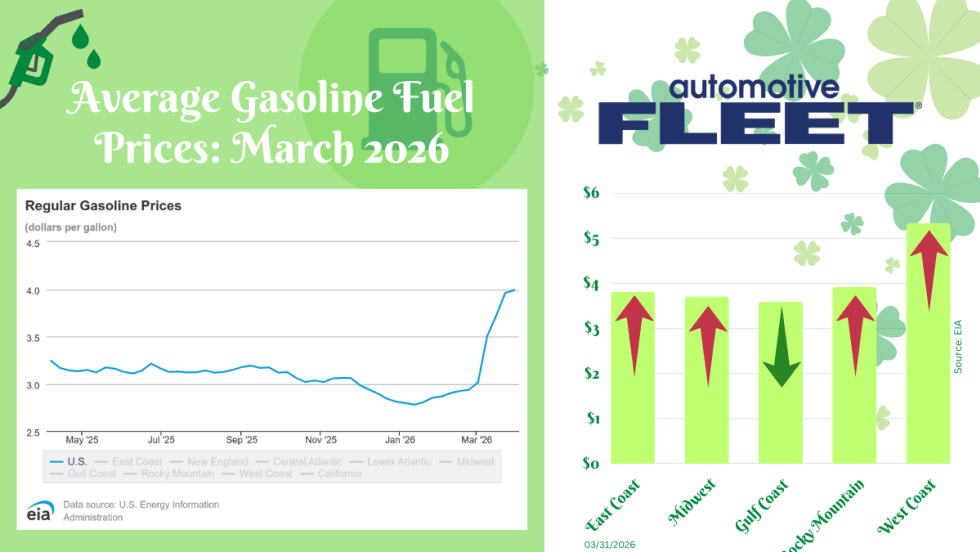
March Fuel Update: Prices Settle With a $4 Average
Fuel prices significantly slowed this week, but a $4 national average is still expected.
Read More →