

Crude Topping $50 Could Mark Oil Tipping Point
Analysts contend that the crude oil supply-and-demand imbalance will be righted just as soon as the price climbs high enough to compel U.S. shale-oil drillers to again ramp up production.


Photo: Federal Reserve Bank of New York

Photo: Federal Reserve Bank of New York
For the first time this year, crude-oil futures briefly floated above $50 per barrel Thursday before closing just below that level. Clearing that mark, a psychological hurdle for many in the market, in itself was no surprise. The price of crude has been on the upswing in recent months, driven by increasing global demand and declining domestic production.
Analysts say the good news is that the supply-and-demand imbalance will be righted just as soon as the price of crude climbs high enough to compel U.S. shale-oil drillers to again ramp up production.
In addition, some events that have recently curtailed oil production elsewhere are being seen as temporary price-drivers, including the wildfires in Canada and a strike by French refinery workers. Of course, there’s no telling what other such supply disruptions could pop up at any time.
Still, on May 26, West Texas Intermediate, the benchmark U.S. grade, hit a high of $50.21, before closing the day at $49.35. Brent crude, the international benchmark grade, finished slightly higher at $50.09.
But early trading on May 27 indicates oil futures are already moving lower. WTI crude was down 35 cents on the New York Mercantile Exchange. That 7% fall-off suggested caution on the part of traders ahead of a June 2 OPEC meeting, reports MarketWatch. The outcome of that meeting could lead Saudi Arabia to up oil production. Overall, crude prices were trading about 1.5% higher for the week, indicating a third weekly gain in a row.
“Crude oil is falling back from $50 a bit in what looks like a normal trading correction,” advised CMC analyst Colin Cieszynski in a May 27 post. “It continues to face considerable resistance at that big round number [$50] ahead of next week’s OPEC meeting, and with traders speculating a price somewhere above, there could be enough to encourage some U.S. [shale-oil] producers to re-enter the market.”
To be sure, crude prices are nowhere near the $100-per-barrel average that held from 2011 to 2014 — when Saudi Arabia began pumping out oil to protect its global market share by driving down global prices. The resulting steep decline in crude prices drove U.S. drillers to cut production.
While the worldwide oil glut meant lower prices at the fuel pump, the pullback in investment, drilling activity, and jobs hurt the U.S. economy as well as trucking companies serving the previously booming market.
Shale-oil producers have yet to step things back up. The U.S. onshore rig count, according to oil services firm Baker Hughes, now stands at 375 — compared to 853 a year ago.
In a May 27 post, Fawad Razaqzada, market analyst at FOREX.com and City Index, contends that as crude continues to rise, “it will become lucrative for U.S. shale oil companies to ramp up production once again, which could put a ceiling on oil prices.” As he sees it, if rig counts begin to stabilize or start to climb, that would serve as “a warning sign for the ongoing oil price rally.”
Razaqzada also points to hedging by oil companies to lock in a higher sell price for future delivery as helping to end the oil upswing. Still, he adds that “it is impossible to say at what price the impact of these bearish factors will start to outweigh the bullish dynamics. But we have now entered the lower band of the $50 to $70 range many think will probably be the top for this current cycle.”
More Fuel

Turning Fleet Payment Data into Executive Insights
Ramel Lindsay of U.S. Bank Voyager discusses how fleets can transform payment and transaction data into actionable intelligence to reduce costs, improve oversight, and support executive decision-making.
Read More →
Why the IRS Raised Its Mileage Rate in the Middle of 2026
Fuel-price volatility drove the rare increase to 76 cents per mile, the fifth midyear adjustment since 2000.
Read More →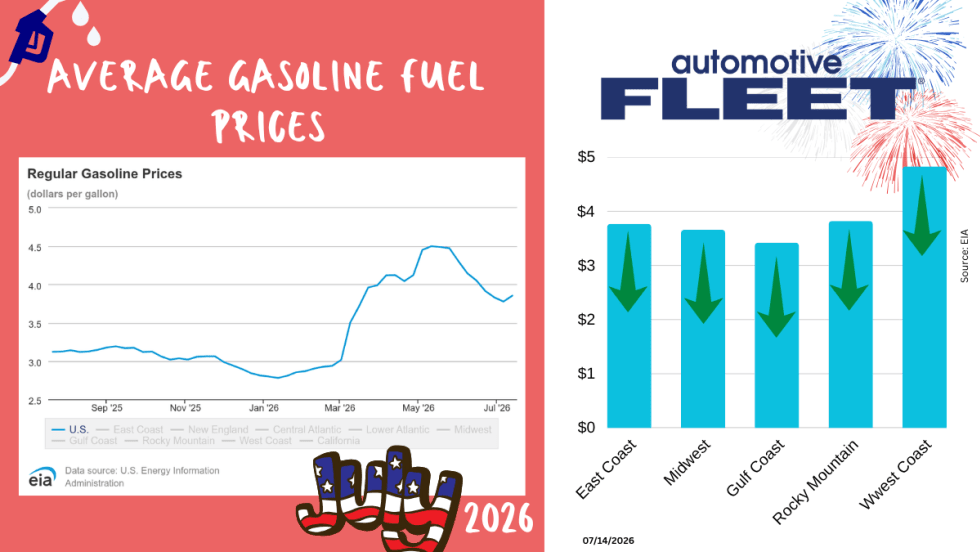
July Fuel Update: Prices Jump for the First Time in Two Months
As the U.S.-Iran ceasefire collapses, so do the gas prices.
Read More →
Bob Adamsky on Fuel Volatility: "Don't Panic, Have a Plan."
When it comes to up and down fuel prices, Adamsky has a message for fleets: “Don’t panic.”
Read More →
How Fleets Can Gain Control of Non-Fuel Spend
Fuel often gets the spotlight, but non-fuel expenses can have a major impact on fleet costs. Ramel Lindsay of U.S. Bank Voyager discusses how fleets can gain better visibility and control over these often-overlooked expenditures.
Read More →
Fuel is Just the Start: How Middle East Tensions are Driving Up Fleet Maintenance Costs
The Middle East conflict is doing more than pushing up fuel prices. It’s also raising the cost of key maintenance products your fleet depends on, from motor oil to tires to windshield wipers. Here’s what you need to know about this budget-busting situation.
Read More →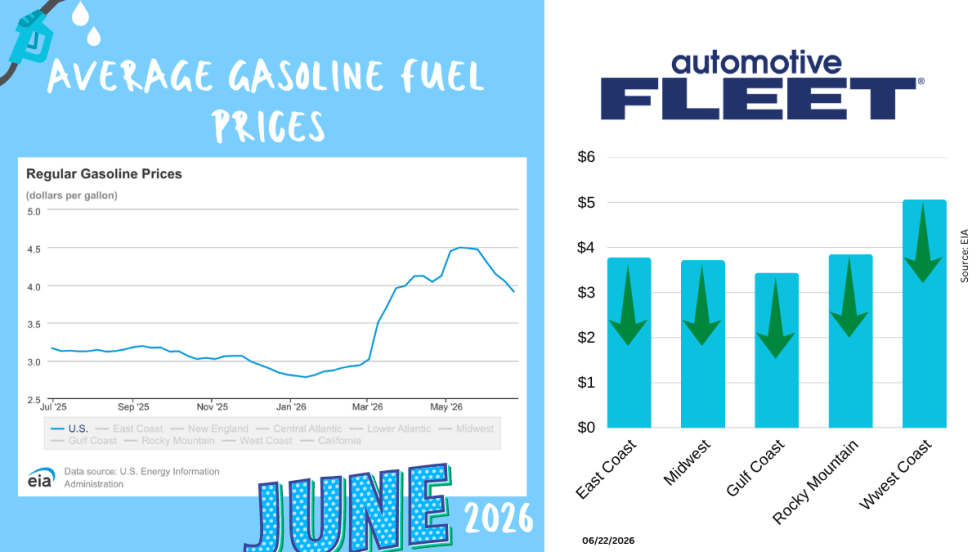
June Fuel Update: Prices Fall Below $4
Drivers are finally getting some relief at the pump. The national average gas price has dropped below $4 a gallon for the first time in months, with prices falling in 47 states as oil markets react to developments in U.S.-Iran negotiations.
Read More →
Study: How 2026's Gas Price Hikes Affect Different Vehicle Types
New data from iSeeCars reveals how rising fuel costs have affected different vehicle segments as gasoline prices climbed nearly 46% over the past four months.
Read More →Are You Tracking Your Fleet's True Total Cost of Ownership?
Bobit Business Media surveyed 190 fleet professionals and found that while most fleets are tracking costs, fragmented systems and data gaps are keeping true TCO visibility out of reach. With rising pressure to control spend in an increasingly volatile environment, the gap between what fleets think they know and what the data actually shows is wider than you might expect. See how your peers are managing costs today and where the industry still has room to improve.
Read More →
May Fuel Update: All Regions Experience Declines
Gas prices are finally easing in much of the country, but experts warn global tensions could quickly reverse the trend as the national average remains well above last month’s levels.
Read More →