

Crossovers Blurring Lines of Fuel Economy Analysis
The growing popularity of crossovers and their ambiguous classification has complicated the analyses of fuel efficiency trends and vehicle sales.
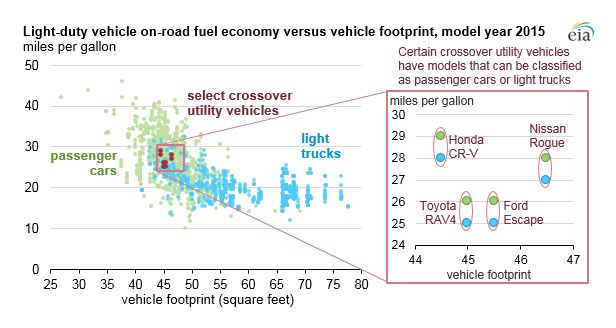
Crossover utility vehicles share elements of both passenger cars and light trucks, complicating their classifications. Chart courtesy of the U.S. Energy Information Administration.

Crossover utility vehicles share elements of both passenger cars and light trucks, complicating their classifications. Chart courtesy of the U.S. Energy Information Administration.
Crossovers complicate fuel-efficiency distinctions between light trucks and passenger cars, according to a U.S. Energy Information Administration (EIA) brief.
Fuel economy standards of light-duty vehicles are normally determined through vehicle footprints, which are defined by the rectangular area between the contact points of a vehicle’s four wheels and the ground.
While crossovers have the appearance of light trucks such as minivans, pickup trucks, and sport-utility vehicles, they share closer design elements to passenger cars, which have smaller vehicle footprints and use more fuel-efficient engines.
In 2016, crossover sales constituted 32% of the light-duty vehicle market, according to automotive analysis group Wards Automotive. The growing popularity of crossovers and their ambiguous classification has complicated the analyses of fuel efficiency trends and vehicle sales. For example, crossovers that were considered light trucks contributed to the overall weighted average of light truck sales.
Government agencies and organizations also use different metrics to classify light-duty vehicles. The Bureau of Economic Analysis, for example, distinguishes light trucks and passenger cars based on vehicle weight limits and appearance, categorizing crossovers as light trucks.
Government organizations like the National Highway Traffic Safety Administration and the U.S. Environmental Protection Agency based fuel economy standards on specific characteristics, meaning crossovers will be classified as passenger cars or light trucks depending on criteria like rider capacity, open bed, and availability of all-wheel drive.
More Fuel

Turning Fleet Payment Data into Executive Insights
Ramel Lindsay of U.S. Bank Voyager discusses how fleets can transform payment and transaction data into actionable intelligence to reduce costs, improve oversight, and support executive decision-making.
Read More →
Why the IRS Raised Its Mileage Rate in the Middle of 2026
Fuel-price volatility drove the rare increase to 76 cents per mile, the fifth midyear adjustment since 2000.
Read More →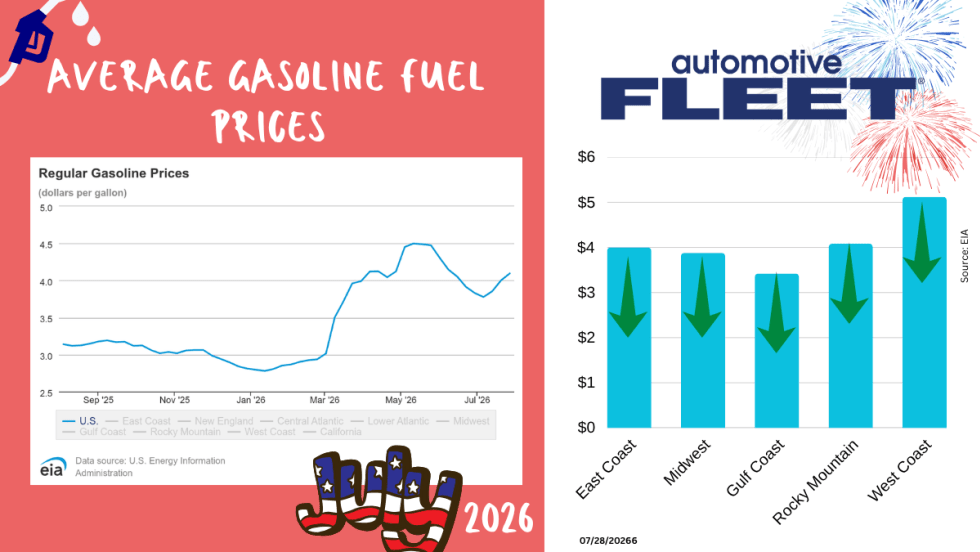
July Fuel Update: Prices Keep Rising in Light of More Conflict
Gas prices continue to rise as more and more conflicts do, too.
Read More →
Bob Adamsky on Fuel Volatility: "Don't Panic, Have a Plan."
When it comes to up and down fuel prices, Adamsky has a message for fleets: “Don’t panic.”
Read More →
How Fleets Can Gain Control of Non-Fuel Spend
Fuel often gets the spotlight, but non-fuel expenses can have a major impact on fleet costs. Ramel Lindsay of U.S. Bank Voyager discusses how fleets can gain better visibility and control over these often-overlooked expenditures.
Read More →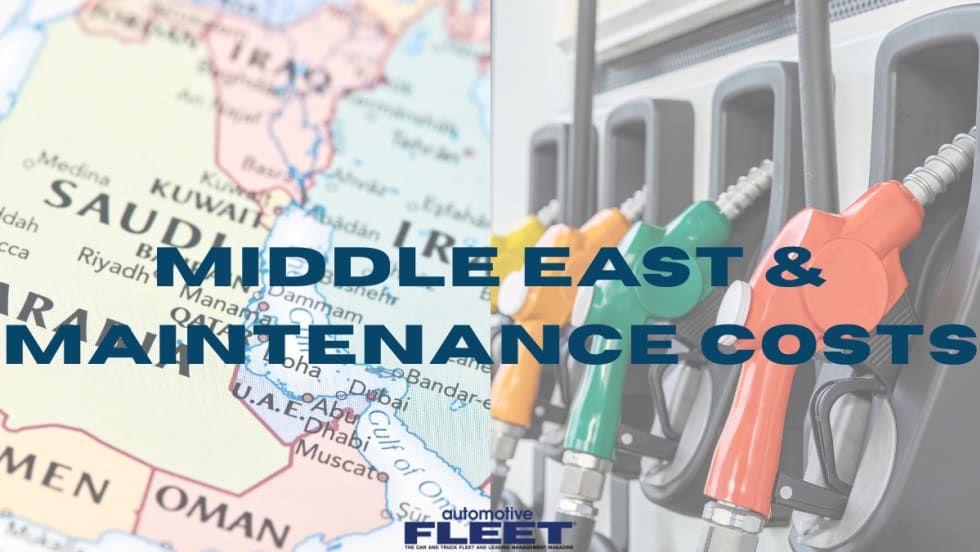
Fuel is Just the Start: How Middle East Tensions are Driving Up Fleet Maintenance Costs
The Middle East conflict is doing more than pushing up fuel prices. It’s also raising the cost of key maintenance products your fleet depends on, from motor oil to tires to windshield wipers. Here’s what you need to know about this budget-busting situation.
Read More →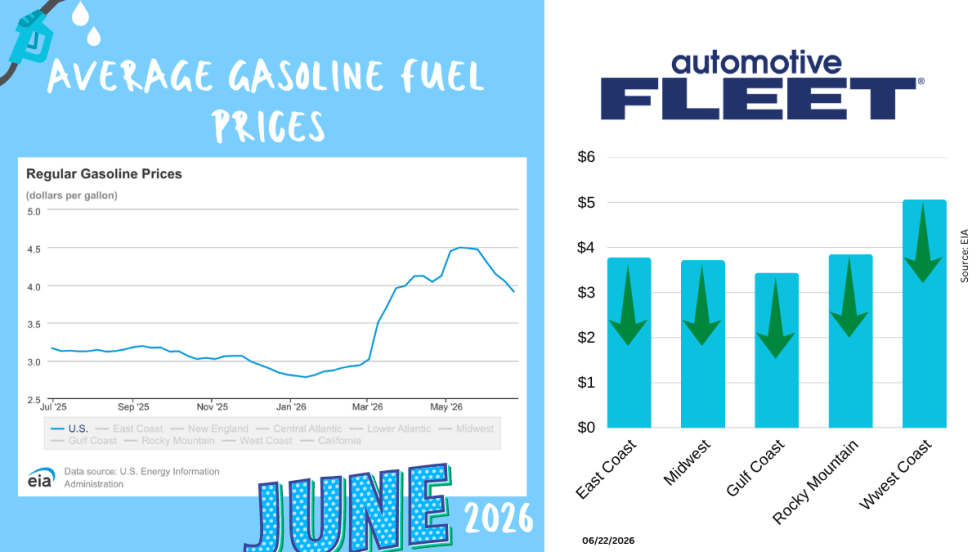
June Fuel Update: Prices Fall Below $4
Drivers are finally getting some relief at the pump. The national average gas price has dropped below $4 a gallon for the first time in months, with prices falling in 47 states as oil markets react to developments in U.S.-Iran negotiations.
Read More →
Study: How 2026's Gas Price Hikes Affect Different Vehicle Types
New data from iSeeCars reveals how rising fuel costs have affected different vehicle segments as gasoline prices climbed nearly 46% over the past four months.
Read More →Are You Tracking Your Fleet's True Total Cost of Ownership?
Bobit Business Media surveyed 190 fleet professionals and found that while most fleets are tracking costs, fragmented systems and data gaps are keeping true TCO visibility out of reach. With rising pressure to control spend in an increasingly volatile environment, the gap between what fleets think they know and what the data actually shows is wider than you might expect. See how your peers are managing costs today and where the industry still has room to improve.
Read More →
May Fuel Update: All Regions Experience Declines
Gas prices are finally easing in much of the country, but experts warn global tensions could quickly reverse the trend as the national average remains well above last month’s levels.
Read More →