

Biodiesel Imports Plummet 36 Percent
After reaching record levels in 2013, United States imports of biomass-based diesel fuel (both biodiesel and renewable diesel) fell 36 percent, to 333 million gallons in 2014.
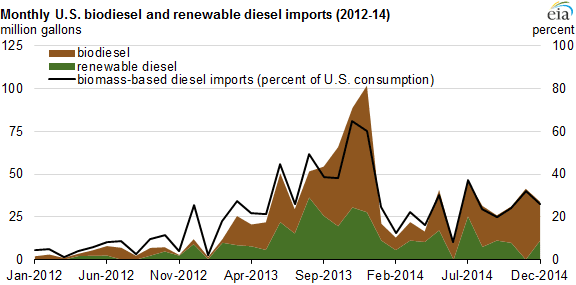
Chart: U.S. Energy Information Administration
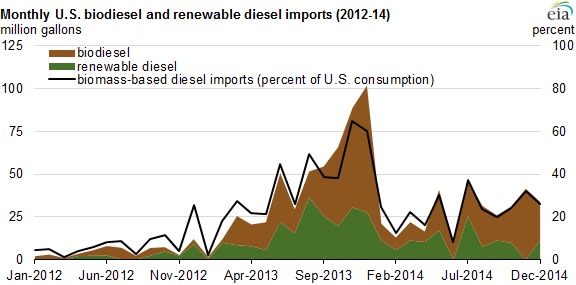
Chart: U.S. Energy Information Administration
After reaching record levels in 2013, United States imports of biomass-based diesel fuel (both biodiesel and renewable diesel) fell 36 percent, to 333 million gallons in 2014. Uncertainty surrounding future Renewable Fuel Standard (RFS) targets and the absence of a late-year influx of volumes from Argentina were two main factors in this decline, according to analysis by the U.S. Energy Information Administration (EIA).
The strongest drivers of the resurgence in U.S. biomass-based diesel demand since 2012 have been increasing RFS targets and the on-again, off-again biodiesel tax credit, according to the EIA. Biodiesel and renewable diesel are valuable because they qualify for the two major renewable fuel programs in the United States: the RFS applied at the national level, and California's Low Carbon Fuel Standard (LCFS). Biomass-based diesel fuels have additional advantages over other renewable fuels because of their relatively high energy content and low carbon intensity, which allow them to qualify for higher credit values in both renewable fuel programs.
Both biodiesel and renewable diesel fuels are produced from refining vegetable oils or animal fats. Biodiesel is blended with petroleum diesel up to 5 percent or 20 percent by volume (referred to as B-5 and B-20, respectively). Renewable diesel is a diesel-like fuel that meets specifications for use in existing infrastructure and diesel engines, and thus is not subject to any blending limitations.
While the RFS is meant to encourage the production and consumption of renewable fuels, obligations for 2014 still have not been finalized and those for 2015 have not yet been proposed. The initial proposal for the 2014 RFS program year, released in November 2013, stated that the 2014 biomass-based diesel obligation would remain unchanged from its 2013 value at 1.28 billion gallons, while the advanced biofuels obligation would be reduced to 2.2 billion gallons, down from 2.75 billion gallons in 2013. The uncertainty and proposed lower target levels have made it difficult for refiners to comply with the RFS recently, but the flexibility and value of biomass-based diesel volumes towards all obligation levels make it a strong driver of biodiesel consumption as long as the RFS is still active, according to the EIA analysis.
There are two other factors that may explain lower biomass-based diesel imports in 2014. In late 2013, there was a surge of biodiesel imports from Argentina as a result of European Union (EU) antidumping duties placed on Argentine biodiesel. This action by the EU temporarily diverted large volumes of Argentine biomass-based diesel that were previously destined to be exported to Europe, Argentina's largest biodiesel export market, to the United States. U.S. imports of biodiesel from Argentina fell by 57 percent from 2013 to 52 million gallons in 2014, according to the analysis.
Another factor was the expiration of the $1.00 per gallon biodiesel tax credit at the end of 2013, the EIA said. While the credit was retroactively restored at the end of 2014, the extent to which producers considered this outcome in making decisions during 2014 remains unknown. Still, relatively high diesel fuel prices for much of 2014 kept domestic biodiesel relatively economic to blend, supporting production at levels near those in 2013. Domestic biomass-based diesel production was sufficient to meet most of the proposed reduced RFS obligations in 2014, thus reducing the need for imports. Total imports of biodiesel and renewable diesel represented an average of 23 percent of domestic biomass-based diesel consumption in 2014, down from an average of 34 percent of consumption in 2013.
The 212 million gallons of biodiesel imported into the United States in 2014 was sourced primarily from Canada (47 percent), reclaiming its spot as the top U.S. supplier after being surpassed by Argentina in 2013, according to the EIA. The remaining volumes of regular biodiesel imports entered the United States primarily on the East Coast, mostly from Indonesia and Argentina. U.S. renewable diesel imports reached 121 million gallons in 2013, down 42 percent from 2013. Slightly more than 92 percent of total U.S. renewable diesel imports came from Singapore and entered the United States primarily through West Coast ports, likely destined for California LCFS compliance.
More Fuel

Turning Fleet Payment Data into Executive Insights
Ramel Lindsay of U.S. Bank Voyager discusses how fleets can transform payment and transaction data into actionable intelligence to reduce costs, improve oversight, and support executive decision-making.
Read More →
Why the IRS Raised Its Mileage Rate in the Middle of 2026
Fuel-price volatility drove the rare increase to 76 cents per mile, the fifth midyear adjustment since 2000.
Read More →
July Fuel Update: Prices Jump for the First Time in Two Months
As the U.S.-Iran ceasefire collapses, so do the gas prices.
Read More →
Bob Adamsky on Fuel Volatility: "Don't Panic, Have a Plan."
When it comes to up and down fuel prices, Adamsky has a message for fleets: “Don’t panic.”
Read More →
How Fleets Can Gain Control of Non-Fuel Spend
Fuel often gets the spotlight, but non-fuel expenses can have a major impact on fleet costs. Ramel Lindsay of U.S. Bank Voyager discusses how fleets can gain better visibility and control over these often-overlooked expenditures.
Read More →
Fuel is Just the Start: How Middle East Tensions are Driving Up Fleet Maintenance Costs
The Middle East conflict is doing more than pushing up fuel prices. It’s also raising the cost of key maintenance products your fleet depends on, from motor oil to tires to windshield wipers. Here’s what you need to know about this budget-busting situation.
Read More →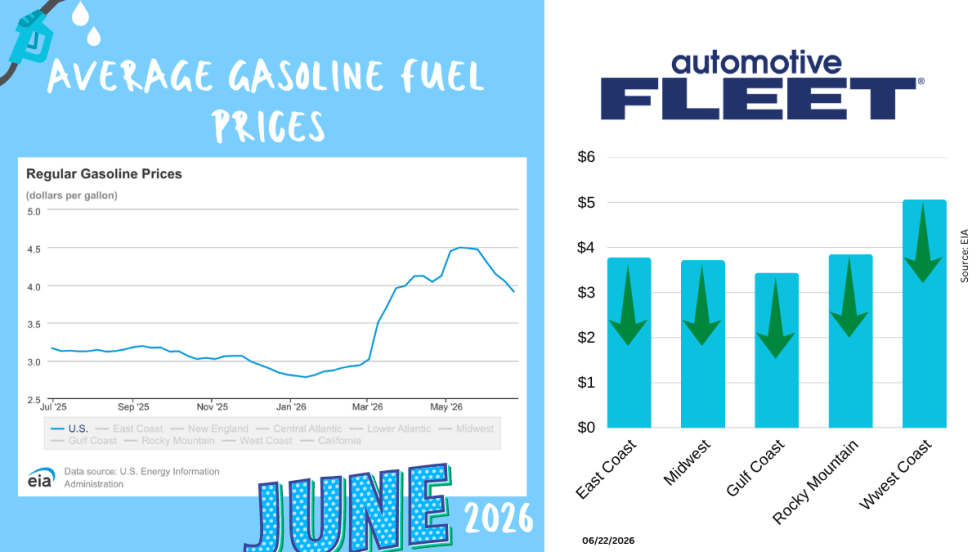
June Fuel Update: Prices Fall Below $4
Drivers are finally getting some relief at the pump. The national average gas price has dropped below $4 a gallon for the first time in months, with prices falling in 47 states as oil markets react to developments in U.S.-Iran negotiations.
Read More →
Study: How 2026's Gas Price Hikes Affect Different Vehicle Types
New data from iSeeCars reveals how rising fuel costs have affected different vehicle segments as gasoline prices climbed nearly 46% over the past four months.
Read More →Are You Tracking Your Fleet's True Total Cost of Ownership?
Bobit Business Media surveyed 190 fleet professionals and found that while most fleets are tracking costs, fragmented systems and data gaps are keeping true TCO visibility out of reach. With rising pressure to control spend in an increasingly volatile environment, the gap between what fleets think they know and what the data actually shows is wider than you might expect. See how your peers are managing costs today and where the industry still has room to improve.
Read More →
May Fuel Update: All Regions Experience Declines
Gas prices are finally easing in much of the country, but experts warn global tensions could quickly reverse the trend as the national average remains well above last month’s levels.
Read More →