




Allstate Study Names Sioux Falls Drivers as Safest in U.S.
NORTHBROOK, Ill. --- Residents of Sioux Falls, S.D., are still the safest drivers in the U.S., according to the third annual "Allstate America's Best Drivers Report."
NORTHBROOK, Ill. --- Residents of Sioux Falls, S.D., are still the safest drivers in the U.S., according to the third annual "Allstate America's Best Drivers Report." The average driver in Sioux Falls will experience an auto collision every 13.7 years. Since the national average is a crash every 10 years, Sioux Falls motorists are 27 percent less likely to get into a car accident. "The fact that Sioux Falls drivers retained the standing as America's safest drivers for two years in a row is an accomplishment for which all Sioux Falls residents should be proud," said Sioux Falls Mayor Dave Munson. "The quality of our community driver education programs, combined with the careful consideration of our traffic engineering department, goes a long way to make our roadways safe for everyone." Parked in the runner-up position for the second consecutive year is Fort Collins, Colo. Motorists in Fort Collins experience a car crash every 13.6 years, on average. For the past three years, Allstate actuaries have conducted an in-depth analysis of company claim data to determine the likelihood of drivers in America's 200 largest cities to experience a vehicle collision compared to the national average. Allstate's auto policies represent about 12 percent of the U.S. population, making this report a realistic snapshot of what's happening on America's roadways. "The primary purpose of this study is to elevate the safe driving discussion by sharing Allstate's report regarding motorists' driving habits with the public," said Mike Roche, senior vice president of Allstate's claim organization. "We hope that our findings can help shed light on communities with drivers that could be more tolerant and attentive behind the wheel as well as provide a platform to recognize cities with drivers that have collectively improved over time." This year, Allstate compared all three years of report data to identify cities with the most improved drivers since 2005. A flock of Michigan cities landed in the top five slots: Sterling Heights, Detroit, Grand Rapids, Warren and, in first place, Flint. Flint improved its average years between accidents from 9.8 years in 2005 to 13.4 years --- 25.4 percent better than the national medium in 2007. Flint leaped from the number 73 spot in 2005 to number three overall in 2007 in three years. Here's a list of the most improved cities and their overall ranking, along with the 2005 to 2007 increase in years between accidents: 3. Flint, Mich. --- 3.6 years 4. Warren, Mich. --- 3.2 years 24. Grand Rapids, Mich. --- 2.8 years 25. Detroit --- 2.7 years 12. Sterling Heights, Mich. --- 2.3 years 54. Aurora, Colo. --- 1.8 years 16. Lexington-Fayette, Ky. --- 1.7 years 140. Yonkers, N.Y. --- 1.3 years 187. Arlington, Va. --- 1.3 years 191. Alexandria, Va. --- 1.2 years "We've seen a nearly continual decrease in crashes statewide in Michigan in the last 10 years, including a 54 percent decrease in serious injury crashes -- that's 9,000 fewer seriously injured people in 2006 compared to 1996," said David Morena, safety and traffic engineer for the Federal Highway Administration in Lansing, Mich. "This progress in crash reduction is evident also in the statistics for the five cities highlighted in this report by Allstate." Morena attributed the reduction in the overall number and severity of crashes to safety legislation, such as primary seat belt law and graduated licensing for our younger drivers; road infrastructure and operational improvements, and new vehicle safety features. "Finally, we also cannot ignore the probability of some contribution from the state's economy to lower auto collisions. Trends have shown that when our Michigan economy is in a downturn, auto crashes tend to reduce as well," Morena said. Drivers from Sioux Falls didn't yield their number one slot in this year's report. However, Michigan, Tennessee and Colorado stand out as also being home to some of the country's safest drivers. Two cities from each state are parked in the top 10 on Allstate's list --- consistent with report findings over its three-year history. Midwestern drivers also appear to heed the safety call. Four out of the 10 top cities are in America's heartland, according to the report. Here's a list of the top 10 safest driver cities, showing rank and city, collision likelihood compared to the national average, and the average years between collisions: 1. Sioux Falls, S.D. --- 27.2% less likely; 13.7 years 2. Fort Collins, Colo. --- 26.2% less likely; 13.6 years 3. Flint, Mich. --- 25.4% less likely; 13.4 years 4. Warren, Mich. --- 25.0% less likely; 13.3 years 5. Huntsville, Ala. --- 23.6% less likely; 13.1 years 6. Knoxville, Tenn. --- 22.8% less likely; 13.0 years 7. Chattanooga, Tenn. --- 22.7% less likely; 12.9 years 8. Colorado Springs, Colo. --- 21.3% less likely; 12.7 years 9. Milwaukee, Wisc. --- 21.0% less likely; 12.7 years 10. Des Moines, Iowa --- 20.5% less likely; 12.6 years For the third consecutive year, drivers in Phoenix, Ariz., are the safest big-city commuters, according to Allstate. Phoenix motorists can expect to bump into another vehicle on the roadway every 9.8 years -- slightly more frequent than the national average. Here's a list of big-city driver cities (with populations exceeding 1 million), showing rank and city, collision likelihood compared to national average, and average years between collisions: 78. Phoenix --- 2.0% more likely; 9.8 years 116. San Diego --- 10.9% more likely; 9.0 years 160. San Antonio --- 23.0% more likely; 8.1 years 163. Houston --- 23.9% more likely; 8.1 years 169. New York --- 27.0% more likely; 7.9 years 178. Dallas --- 29.7% more likely; 7.7 years 183. Chicago --- 34.4% more likely; 7.4 years 185. Los Angeles --- 44.7% more likely; 6.9 years 190. Philadelphia --- 51.9% more likely; 6.6 years Milwaukee drivers topped the list of safest drivers in mid-sized cities with populations between 500,000 to 1 million residents. This is the third consecutive year that the Wisconsin city has claimed this honor. Milwaukee drivers experience a car accident once every 12.7 years on average, 21 percent less likely than the average driver. Drivers located in the top 10 cities in this break-out list for mid-sized cities are above average, level-headed drivers when compared to the average driver. Here's the list for mid-size city drivers, showing rank/city, collision likelihood compared to national average, and the average years between collisions: 9. Milwaukee -- 21.0% less likely; 12.7 years 25. Detroit --- 13.5% less likely; 11.6 years 28. Louisville, Ky. --- 13.0% less likely; 11.5 years 33. Memphis, Tenn. --- 11.1% less likely; 11.2 years 36. Nashville, Tenn. --- 9.8% less likely; 11.1 years 39. Denver --- 8.4% less likely; 10.9 years 50. Indianapolis --- 5.0% less likely; 10.5 years 55. Tucson, Ariz. --- 3.8% less likely; 10.4 years 56. El Paso, Texas --- 3.5% less likely; 10.4 years 57. Oklahoma City --- 3.4% less likely; 10.4 years To create its report, Allstate researchers analyzed internal property damage reported claims over a two-year period (from January 2004 to December 2005) to ensure the findings would not be impacted by external influences such as weather or road construction. A weighted average of the two-year numbers determined the annual percentages. The report defines an auto crash as any collision resulting in a property damage claim.
More Safety
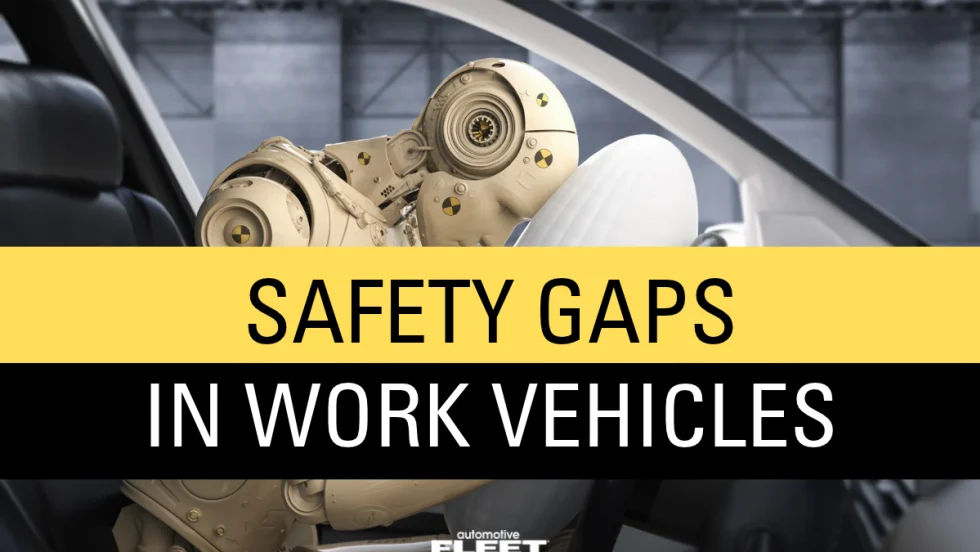
IIHS Crash Avoidance Tests Reveal Safety Gaps in Cargo Vans and Work Trucks
New crash-avoidance ratings from the Insurance Institute for Highway Safety reveal inconsistent performance among commercial vehicles, with several popular cargo vans and heavy-duty pickups struggling to avoid collisions with other vehicles and pedestrians.
Read More →
What’s Next for Fleet? Safety, AI & Industry Recognition | AF News Recap
Could your company's culture be encouraging distracted driving? This week, we're exploring how workplace expectations affect driver safety, what AI, EVs, and autonomous vehicles could mean for the future of fleet management, and how fleet professionals can strengthen their award nominations.
Read More →
Does Your Fleet's Culture Encourage Distracted Driving?
What happens when the people responsible for enforcing safety rules are the ones setting the wrong example? The answer may reveal why some of the biggest risks to fleet drivers have little to do with what's written in the employee handbook.
Read More →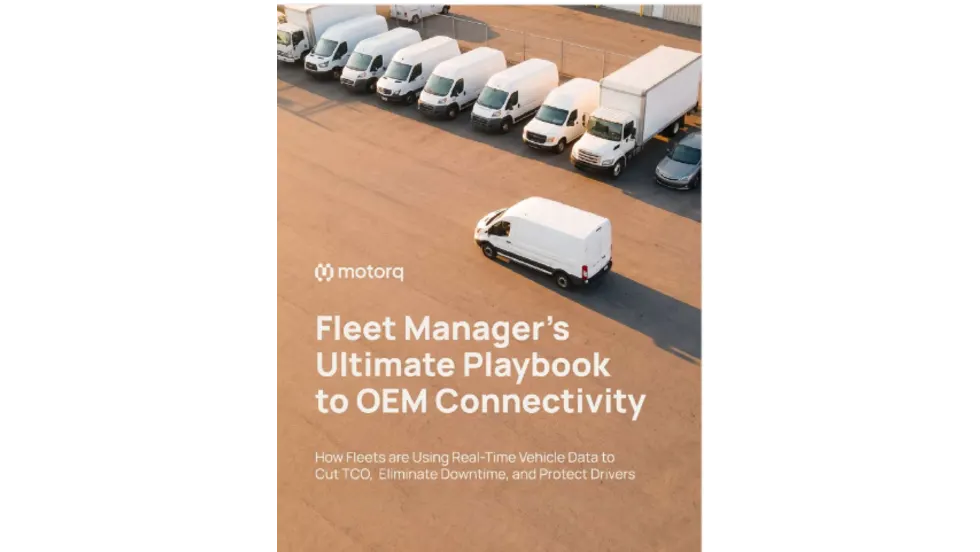
Fleet Manager’s Ultimate Playbook: Navigating the New Standard in OEM Connectivity
Rising operating costs, driver safety concerns, and unplanned downtime are putting unprecedented pressure on modern fleets. Discover how fleet managers use embedded OEM connectivity and real-time vehicle data to cut TCO, prevent downtime, and protect drivers without aftermarket telematics hardware.
Read More →
From Driver Well-Being to EV Charging | AF News Recap
Mental health belongs in the fleet safety conversation. This week, we’re looking at five ways fleets can support employee well-being before a crisis, plus Holman’s expansion in Mexico, new one-day Fleet Forward passes, and why EV charging demand is outpacing infrastructure growth.
Read More →
Nexar-Nauto Merger Aims to Give Fleets Better Safety Intelligence Through Larger Driving Dataset
Stefan Heck tells Automotive Fleet that combining more than 10 billion miles of driving history with Nexar's AI models will give fleets deeper insights into driver risk and roadway conditions than either company could provide independently.
Read More →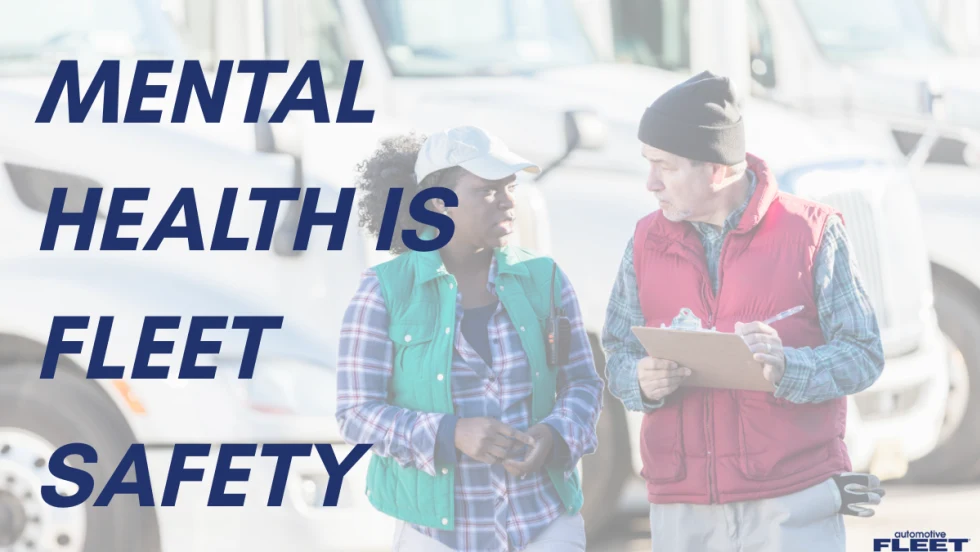
Don't Wait for a Crisis: 5 Ways to Build Mental Health Into Your Fleet Safety Program
For Suicide Prevention Month, fleet and safety leaders have an opportunity to put mental health where it belongs: at the center of workplace safety.
Read More →
How Camera Data Can Strengthen a Fleet’s Insurance Renewal
Insights from a commercial insurance carrier and a broker show how fleets can turn video telematic data, driver coaching, and improved claims results into a stronger case at insurance renewal.
Read More →
The Safest Fleets Aren’t the Ones with the Most Technology
You’ve made the telematics investment. Here’s how to capture the other half of its value and build the safest fleet on the road.
Read More →
Hidden in Plain Sight: Fleet Compliance Risks
Fleet compliance isn't just about having policies — it's about consistently enforcing them. This practical guide reveals six hidden compliance risks common in public sector and shared fleet operations and outlines proven strategies to improve visibility, accountability, and audit readiness
Read More →