Articles
The EV Breakdown Nobody's Talking About: Why Most Electric Vehicle Roadside Calls Aren't Mechanical Failures
Here's why EV breakdowns are widely misunderstood.
Read More →Here's why EV breakdowns are widely misunderstood.
Read More →
While federal incentives for electric vehicles are set to sunset on September 30, states such as California, Massachusetts, Oregon, New Jersey, and New York have announced new programs for fleets and new funding for existing ones.
Read More →
NAFA announced the winners of its 2025 Green Fleet Awards—recognizing fleets that are leading the way in environmental responsibility and innovative fleet operations.
Read More →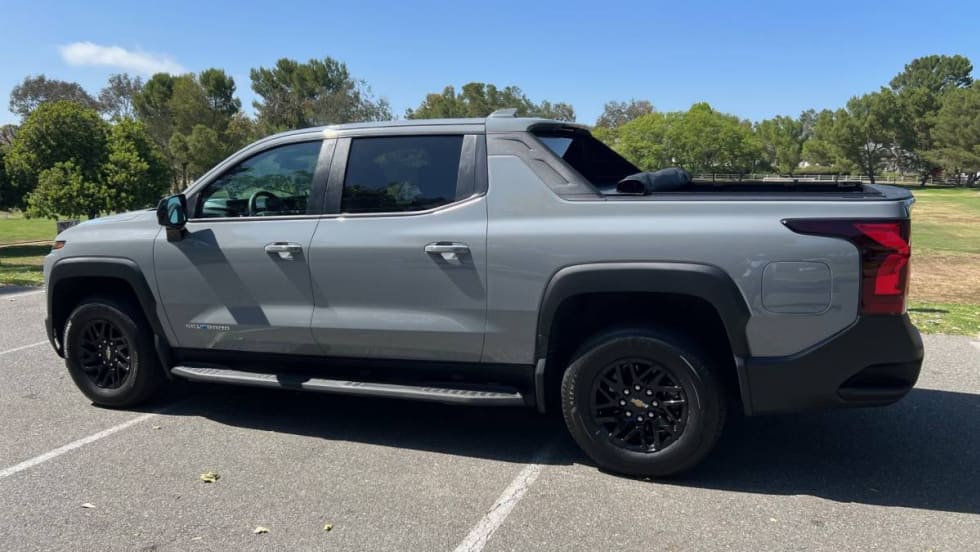
2025 Chevy Silverado EV WT 8 review: does this electric work truck deliver on range, power, and real-world fleet needs?
Read More →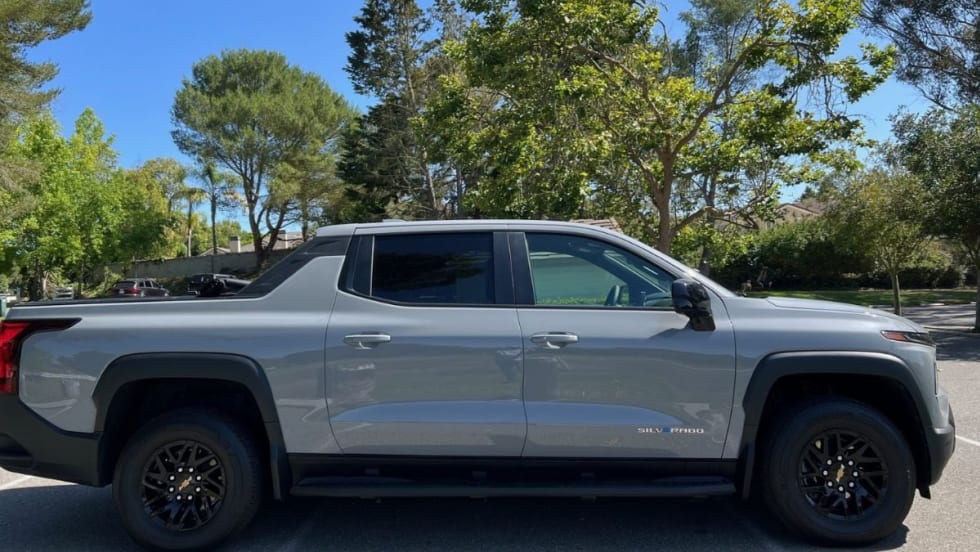
The longest-range all-electric work truck can solve many challenges for fleet operations with its wide array of features and power usage.
Read More →
Fleet electrification plans are accelerating, but research from The Futurum Group finds most operators lack workplace and home charging policies. Fleet managers must close these gaps to ensure cost control and compliance.
Read More →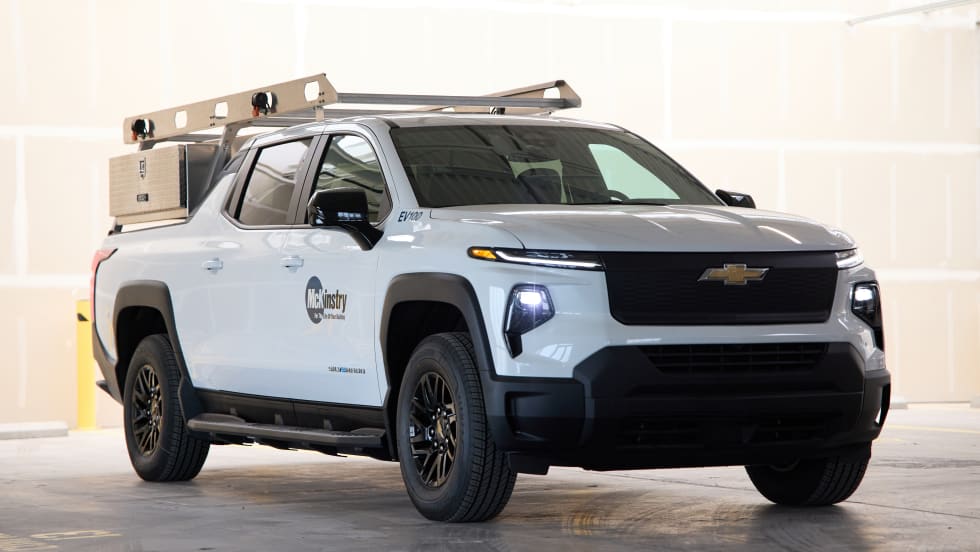
By deploying more than 100 electric vehicles — including fully upfitted Silverado EV pickups — in demanding construction and service roles, the Seattle-based builder is showing how electrification can work beyond pilot programs when matched carefully to duty cycles, infrastructure, and driver readiness.
Read More →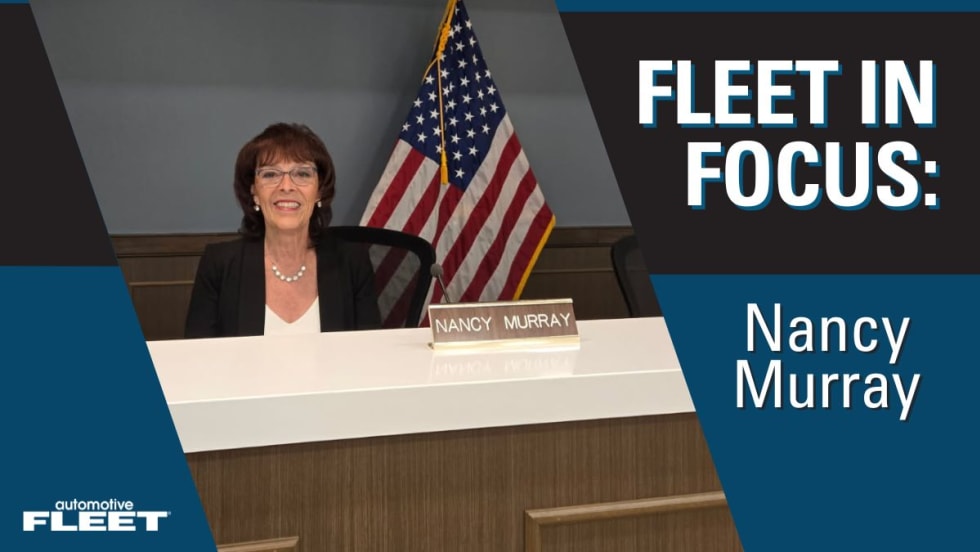
Meet Nancy Murray in this installment of Fleet in Focus, an ongoing series dedicated to highlighting careers of the fleet community’s most hard-working and standout individuals.
Read More →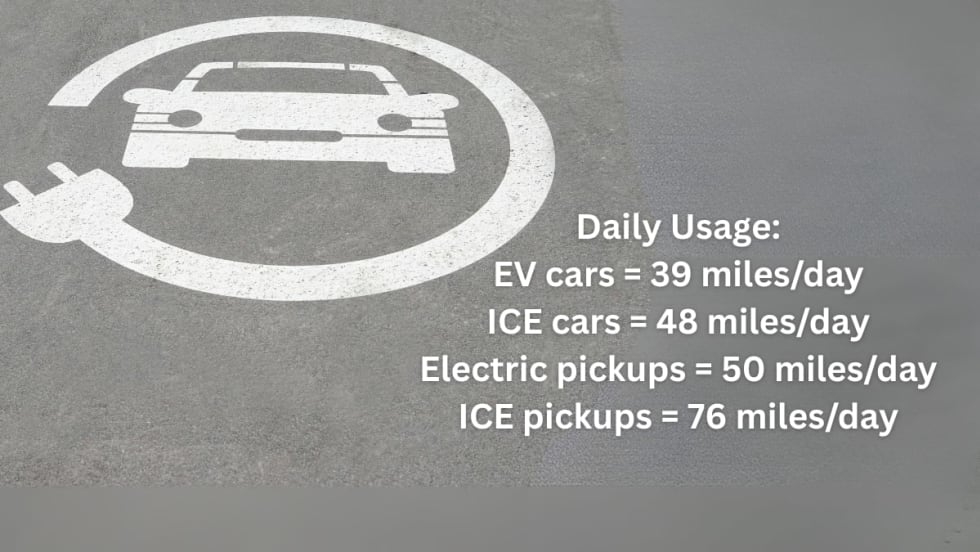
The rise of EV use amongst fleets has started to display usage patterns.
Read More →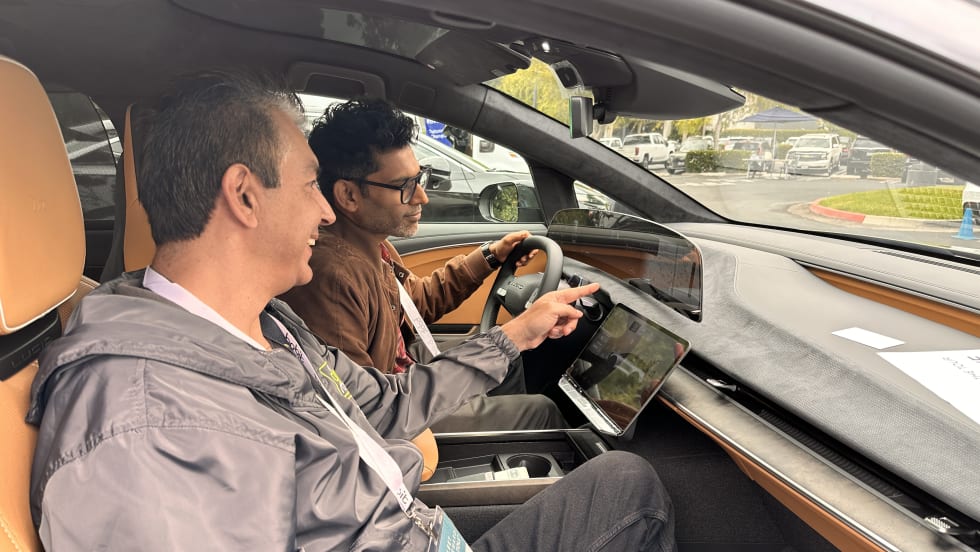
California fleet managers test drove new EVs from major OEMs on July 22 at the regional conference in Irvine, California.
Read More →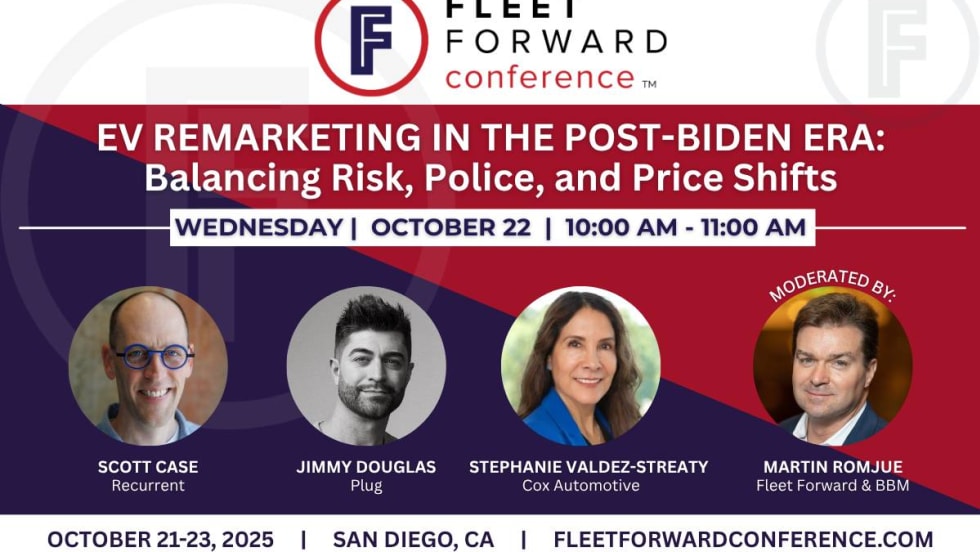
Learn more about market results and effects from a major shift in federal electric vehicle policies and incentives at the upcoming Fleet Forward Conference.
Read More →