




Off-the-Job Crashes Account for 43% of Employers’ $61.7 Billion Crash Burden
NETS quantifies costs dispersed across fleet, risk, HR, and other departments while providing new per-crash benchmarks for employers.

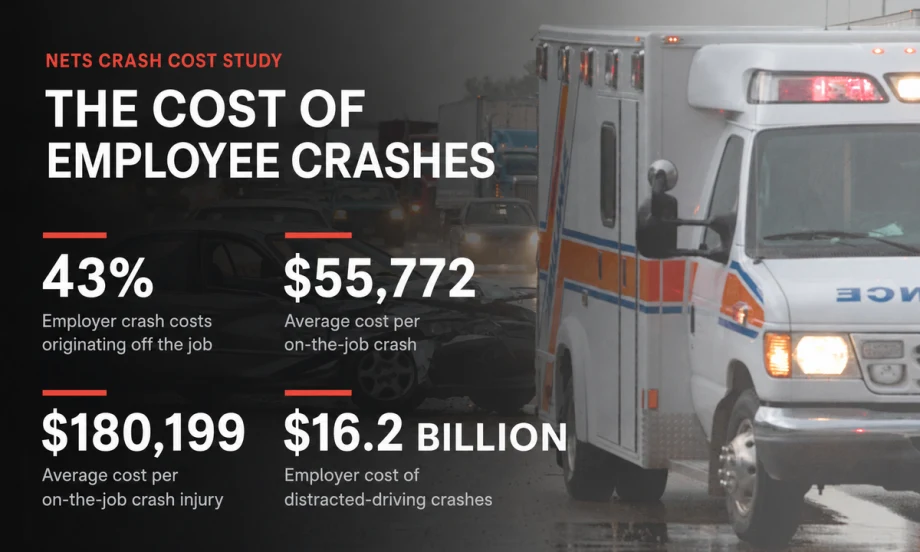
NETS’ latest analysis captures the broader financial impact of crashes across fleet, risk, HR, benefits, and operations, not just the costs visible on a vehicle repair or insurance claim.
Elements of this image were generated by OpenAI. Please refer to our terms of use.
Motor vehicle crashes cost U.S. employers $61.7 billion in 2023, according to the latest analysis from the Network of Employers for Traffic Safety (NETS).
On-the-job crashes accounted for $35.3 billion, or 57%, of that total. The remaining $26.4 billion — 43% of all employer crash costs — resulted from off-the-job crashes involving employees and their dependents.
The indirect costs of crashes are not new to fleets, but they are often dispersed across departments and budgets. Repair and claim expenses may sit with fleet or risk management, while health insurance, workers’ compensation, sick leave, disability benefits, liability, and lost productivity are carried elsewhere in the organization.
The report is called “Costs of Motor Vehicle Crashes to Employers: Latest Available Estimates and Key Findings” and is available to download.
Putting the National Cost Into Fleet Terms
A $61.7 billion national estimate can be difficult for an individual fleet to put into context. To make the findings more operational, NETS calculated average employer costs based on crashes, injuries, fatalities, and miles traveled.
The report estimates that on-the-job highway crashes cost employers an average of:
- $55,772 per crash.
- $59,745 per million vehicle-miles traveled.
- $180,199 per fatal or nonfatal injury.
- $171,135 per nonfatal injury.
- $927,276 per fatality.
- $11,794 per property-damage-only crash.
These figures are national averages, not predictions for a particular fleet. Actual costs will vary according to crash severity, vehicle type, liability exposure, workforce characteristics, insurance arrangements, and industry.
They nevertheless provide fleet managers with a starting point for estimating the scale of their own exposure.
For example, applying the per-crash benchmark to a fleet with 100 on-the-job crashes would produce an estimated employer burden of approximately $5.6 million. Applying the mileage benchmark to a fleet traveling 50 million miles would produce an estimate of approximately $3 million.
The two approaches will not necessarily generate matching results because they are separate national benchmarks. Instead, they offer different ways to place a fleet’s crash experience in context and evaluate the potential return from safety investments.
The Employer Share of a Much Larger Burden
The $61.7 billion represents only the portion of crash costs absorbed by employers.
NETS estimates that U.S. highway crashes generated approximately $350 billion in broader economic costs in 2023, excluding costs attributed to congestion and wage-risk premiums.
Employers absorbed approximately 17% of the highway-crash burden. The remaining costs were borne by government, private passenger vehicle insurers, and individual crash victims.
The $61.7 billion is close to, but not exactly 17%, of the $350 billion highway-crash estimate. The employer figure also includes certain occupational crashes that occurred away from public roads.
Even as one part of the broader economic burden, the employer share is substantial. It includes expenses incurred through occupational crashes as well as costs generated by crashes involving employees and their dependents outside of work.
What Employers Are Paying For
NETS divided the $61.7 billion employer burden into two broad categories.
Health-related fringe-benefit costs totaled $28 billion. These expenses include workers’ compensation, health insurance, disability and life insurance, Social Security, sick leave, and the administration of those benefits.
Non-fringe costs added another $33.6 billion. This category includes vehicle and property damage, workplace disruption, liability for injuries or damage suffered by others, employee replacement and retraining, and other direct and indirect expenses.
Crashes involving property damage but no injuries accounted for $7.1 billion of the total.
Employer Costs Extend Beyond the Workday
One of the report’s most consequential findings is the concentration of benefit costs outside occupational driving.
Off-the-job crashes involving employees and their dependents generated $24.3 billion, or 87% of employers’ $28 billion in crash-related health and fringe-benefit costs.
Those expenses included nearly $10.2 billion in sick leave and $9.9 billion in health insurance and self-funded medical costs. Off-the-job crashes also generated costs through disability insurance, life insurance, Social Security, and benefit administration.
The report classifies crashes according to whether they occurred on or off the job. It does not identify whether an employee was driving a personal vehicle or a company vehicle at the time. The findings therefore should not be interpreted as a measure of gray-fleet exposure.
They do demonstrate that an employer’s financial exposure extends well beyond the vehicles and drivers directly managed by the fleet department.
Fleet managers have greater control over occupational driving, but the findings support extending safety communications and resources across the employee population. Seat-belt use, distraction, speeding, and impairment affect employer costs regardless of whether an employee is driving for work.
The Occupational Crash Burden
The off-the-job findings do not diminish the scale of occupational driving risk.
NETS estimates that motor vehicle crashes killed 1,877 people and injured approximately 155,000 while they were working in 2023. More than half of the injuries resulted in lost workdays.
On-the-job drivers were also involved in approximately 930,000 crashes without injuries.
The analysis includes work-related crashes on public roads as well as some incidents occurring elsewhere, such as a forklift rollover in a warehouse or an employee struck by a refuse truck at a landfill. On-the-job crash injuries represented approximately 7% of all crash injuries on public roads.
Four Behaviors Generate Billions in Costs
The report also estimated the employer burden associated with four familiar crash risks:
- Distracted-driving crashes cost employers $16.2 billion.
- Alcohol-impaired driving crashes cost $11.7 billion.
- Speed-related crashes cost $6.7 billion.
- Injuries involving unrestrained occupants cost $6.3 billion.
These categories should not be added together because a single crash may involve more than one factor.
Alcohol impairment produced a particularly large off-the-job burden. Of the $11.7 billion in alcohol-related employer costs, approximately $10.5 billion came from crashes involving employees or their dependents off the job.
Seat-belt use also produced a measurable difference at the individual level:
For off-the-job crashes, the corresponding employer costs were $7,900 for an unrestrained occupant and $5,790 for a restrained occupant.
The figures give fleets a financial basis for familiar safety priorities: enforcing seat-belt policies, monitoring speed, addressing distracted driving, identifying high-risk drivers, and extending impairment-prevention resources beyond the driver population.
Costs Vary by Industry
Employer crash costs varied widely according to how intensively an industry uses motor vehicles and the types of vehicles involved.
The industries with the highest estimated costs per employee included:
- Transit: $1,855.
- Trucking: $1,439.
- Waste management and remediation services: $795.
- Stone, clay, glass, and concrete manufacturing: $738.
Government employers incurred an estimated $8.7 billion in on-the-job crash costs. That included $1.1 billion for the federal government, $1.6 billion for state governments, and nearly $6 billion for local governments.
NETS cautioned against treating these figures as simple industry rankings. Differences may reflect vehicle mix, injury severity, workforce characteristics, operational exposure, and the completeness of occupational crash reporting.
How NETS Calculated the Costs
The $61.7 billion figure is a national estimate, not the result of adding up claims submitted by individual employers.
In simplified terms, NETS first estimated how many people were killed or injured in on- and off-the-job crashes. It then applied cost estimates for the different types and severities of crashes to determine the portion ultimately paid by employers.
NETS assembled the analysis from multiple national sources, including federal crash databases, labor statistics, travel data, state crash reports, insurance information, and economic research on the cost of motor vehicle injuries.
The sources include the National Highway Traffic Safety Administration’s Fatality Analysis Reporting System, the Bureau of Labor Statistics’ Census of Fatal Occupational Injuries and Survey of Occupational Injuries and Illnesses, the National Household Travel Survey, state crash reports, and insurance-industry data.
The incidence data primarily reflect 2022 and 2023. The costs are expressed in 2024 dollars.
NETS also adjusted state estimates for differences in medical costs, general living costs, and income. Industry estimates were developed by assigning costs according to the types of vehicles involved in crashes and occupational injury data.
As with any modeled national estimate, the findings have limitations. The completeness of occupational crash reporting varies, and the study must estimate crashes and injuries that are not fully captured in individual databases. Differences among states and industries may therefore reflect reporting practices and economic conditions as well as actual safety performance.
The per-crash, per-injury, and per-mile figures are best used as directional benchmarks. They can help an employer estimate the possible scale of its crash burden, but they do not replace the organization’s own claims, exposure, benefit, and loss data.
More Safety

Fleet Manager’s Ultimate Playbook: Navigating the New Standard in OEM Connectivity
Rising operating costs, driver safety concerns, and unplanned downtime are putting unprecedented pressure on modern fleets. Discover how fleet managers use embedded OEM connectivity and real-time vehicle data to cut TCO, prevent downtime, and protect drivers without aftermarket telematics hardware.
Read More →
From Driver Well-Being to EV Charging | AF News Recap
Mental health belongs in the fleet safety conversation. This week, we’re looking at five ways fleets can support employee well-being before a crisis, plus Holman’s expansion in Mexico, new one-day Fleet Forward passes, and why EV charging demand is outpacing infrastructure growth.
Read More →
Nexar-Nauto Merger Aims to Give Fleets Better Safety Intelligence Through Larger Driving Dataset
Stefan Heck tells Automotive Fleet that combining more than 10 billion miles of driving history with Nexar's AI models will give fleets deeper insights into driver risk and roadway conditions than either company could provide independently.
Read More →
Don't Wait for a Crisis: 5 Ways to Build Mental Health Into Your Fleet Safety Program
For Suicide Prevention Month, fleet and safety leaders have an opportunity to put mental health where it belongs: at the center of workplace safety.
Read More →
How Camera Data Can Strengthen a Fleet’s Insurance Renewal
Insights from a commercial insurance carrier and a broker show how fleets can turn video telematic data, driver coaching, and improved claims results into a stronger case at insurance renewal.
Read More →
The Safest Fleets Aren’t the Ones with the Most Technology
You’ve made the telematics investment. Here’s how to capture the other half of its value and build the safest fleet on the road.
Read More →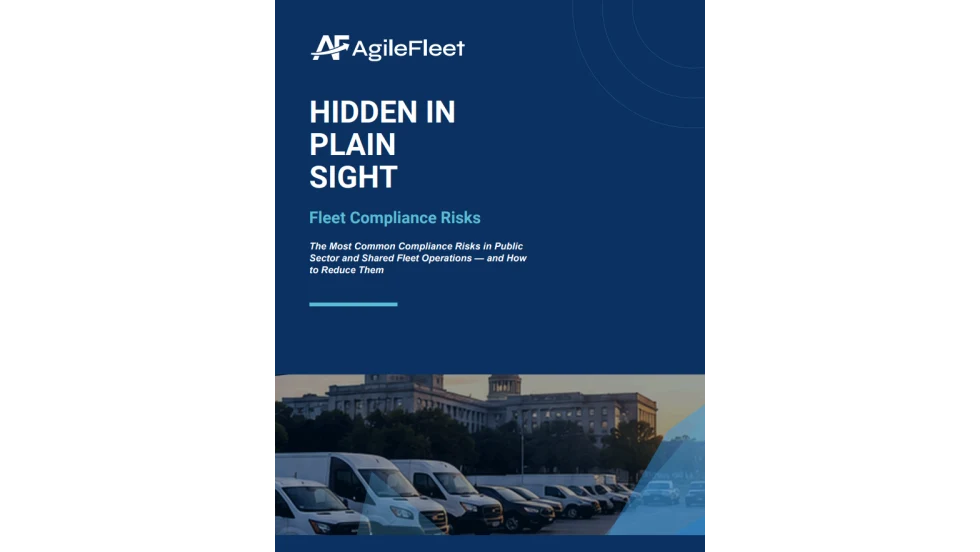
Hidden in Plain Sight: Fleet Compliance Risks
Fleet compliance isn't just about having policies — it's about consistently enforcing them. This practical guide reveals six hidden compliance risks common in public sector and shared fleet operations and outlines proven strategies to improve visibility, accountability, and audit readiness
Read More →
NETS Sets 2026 Fleet Safety Benchmark Conference for Indianapolis
The Sept. 15–17 program will feature fleet benchmarking data, case studies, emerging technologies, and implementation strategies while running alongside the NSC Safety Congress & Expo.
Read More →
Ram Recalls More Than 1.27 Million 1500 Pickups for Seat Belt Anchor Issue
The recall affects certain 2019-2026 Ram 1500 pickups that may have improperly attached second-row seat belt buckle anchors.
Read More →
Operation Safe Driver Week: Why the Industry's Oldest Safety Campaign Still Matters to Fleets
A look at how a 2007 enforcement initiative became one of the most consequential weeks on the fleet safety calendar, and what it means for your drivers in 2026.
Read More →