




Comparing Vans by Lifecycle Cost
This analysis shows that ownership costs for vans with similar powertrains, GVWR, and capacities can vary by manufacturer as much as $9,000.


To ease what could be seen as a paradox of choice, Business Fleet presents this cost comparison for 2016-MY cargo van models based on data from Vincentric.
Photo: Work Truck
When the Ford Transit Connect landed on U.S. shores in 2009, there should’ve been a Paul Revere warning: “The van revolution is coming!” In the years following, new models have grown the commercial van market exponentially compared to overall fleet sales.
Sales of compact and full-size vans are expected to top 500,000 units in the U.S. this year, according to Kelley Blue Book estimates.
Today, fleet operators can choose between large Euro-style unibody vans such as Mercedes-Benz Sprinter, Ford Transit, and Ram ProMaster, as well as body-on-frame models like Nissan NV and General Motors’ G-Series stalwarts Chevrolet Express and GMC Savana.
On the smaller side, the compact van market comprises Ford Transit Connect, Nissan NV200, Ram ProMaster City, and Chevrolet City Express. Mercedes even created a tweener segment when it introduced the midsize Metris van in 2015. (In fairness, we gave the Metris its own category.)
Each of these models has a myriad of capacities, payloads, roof heights, wheelbases, trim levels, and upfits to address almost any work application.
To ease what could be seen as a paradox of choice, Business Fleet presents this cost comparison for 2016-MY cargo van models based on data from Vincentric. Vincentric calculated its standard eight cost elements: depreciation, financing, fees and taxes, fuel, insurance, maintenance, opportunity cost, and repairs. This analysis covers a five-year period with an average of 20,000 miles a year.
Observations
In terms of a strict analysis of ownership costs, the models with the best five-year total cost of ownership (TCO) are the four compact vans. This isn’t surprising, as their initial costs, fuel totals, and overall depreciation are the lowest. The overall TCO winner is Nissan NV200.
In fact, two of Nissan’s larger van models — Nissan NV 1500 and 2500 — record the lowest TCO in the ½- and ¾-ton categories. Ford Transit T350 (low roof, 148-in. wheelbase) wins the 1-ton category.
The TCO for Nissan NV 1500 and 2500 come close to the lifecycle costs of the compact vans. Those larger models offer about three times more payload, towing, and cargo volume than their smaller brothers. In the right fleet application, acquiring vans with the greater capacities could far outweigh the minimal overall cost increase.
Sticking with large vans, moving further up the ladder by weight and capacity will drive up initial costs, fuel, and maintenance expense, which generally correlates with a rise in TCO. Here, a cost comparison of the same class of vans by each manufacturer is helpful. Ownership costs for vans with similar powertrains, GVWR, and capacities can vary by manufacturer as much as $9,000.
Taking this one step further, operators can pinpoint a desired TCO and then ascertain the capabilities of the models that meet that figure. By looking across manufacturers, operators have options to choose “a lot of van for the money.”
Initial cost has only a general correlation with TCO. (Vincentric’s “market price” is calculated as the invoice price, plus the destination, and minus published fleet incentives.) Many vans with low initial costs return a higher TCO — due primarily to higher depreciation.
Low fuel expense, the second largest cost after depreciation, is not always an indicator of lower TCO. The Nissan NV is a prime example — on the low end of fuel economy because of its truck frame, NV models fare very well in TCO.
Diesel models uniformly have lower total fuel costs than their gas-powered brothers. But this savings does not necessarily translate into a lower overall TCO. Higher initial costs, slightly higher maintenance costs, and substantially higher average depreciation than gas models drive up overall costs.
Results May Vary
As they say, “individual results may vary.” This theoretical exercise should be taken with some caveats, as a multitude of real-world variables come into play such as model availability, proximity to franchised dealer servicing, annual mileage, driving performance, vehicle reliability, safety features, and other vehicle-specific options availability.
As well, the Vincentric market price would not reflect individual negotiations on any model in a given market. Any discount could tip the scales to a favorable TCO not reflected here.
Originally posted on Work Truck Online
More Fuel
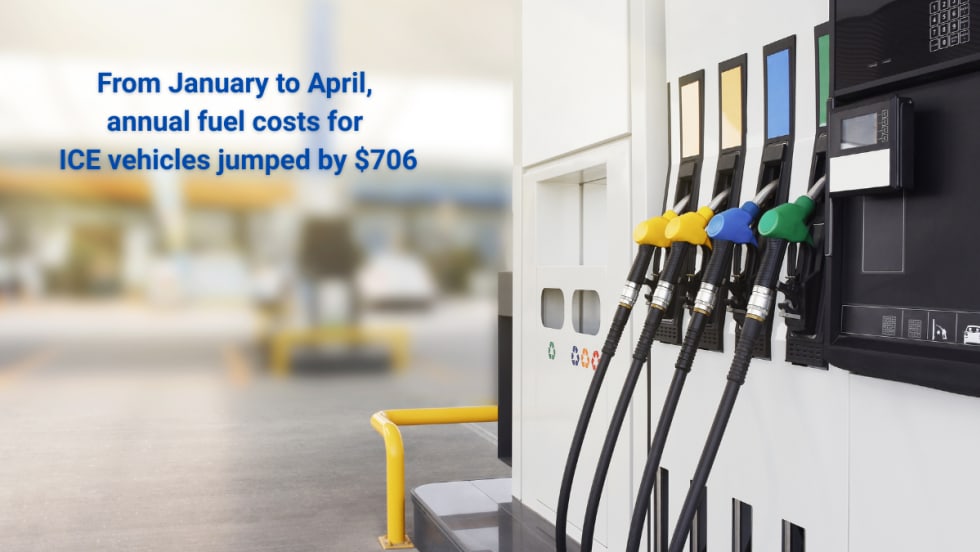
Study: How 2026's Gas Price Hikes Affect Different Vehicle Types
New data from iSeeCars reveals how rising fuel costs have affected different vehicle segments as gasoline prices climbed nearly 46% over the past four months.
Read More →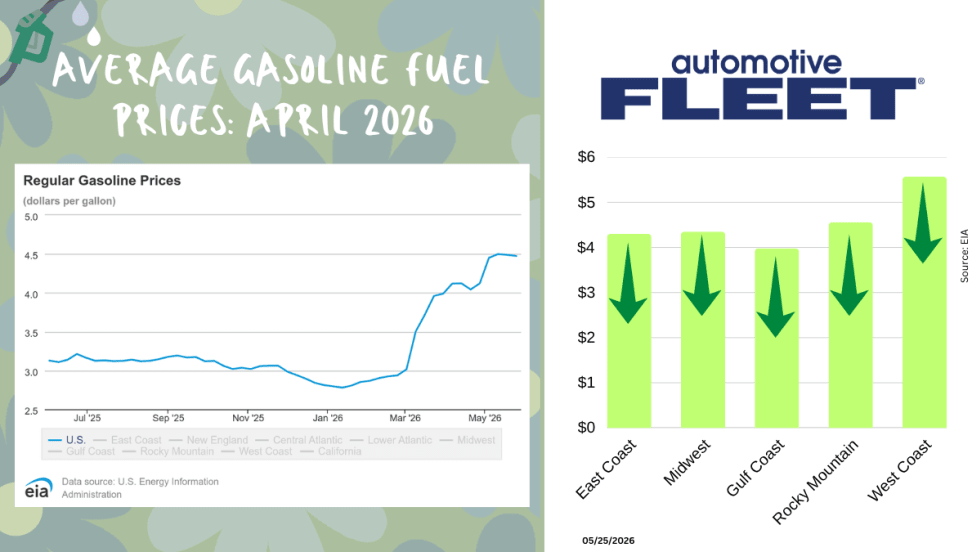
May Fuel Update: All Regions Experience Declines
Gas prices are finally easing in much of the country, but experts warn global tensions could quickly reverse the trend as the national average remains well above last month’s levels.
Read More →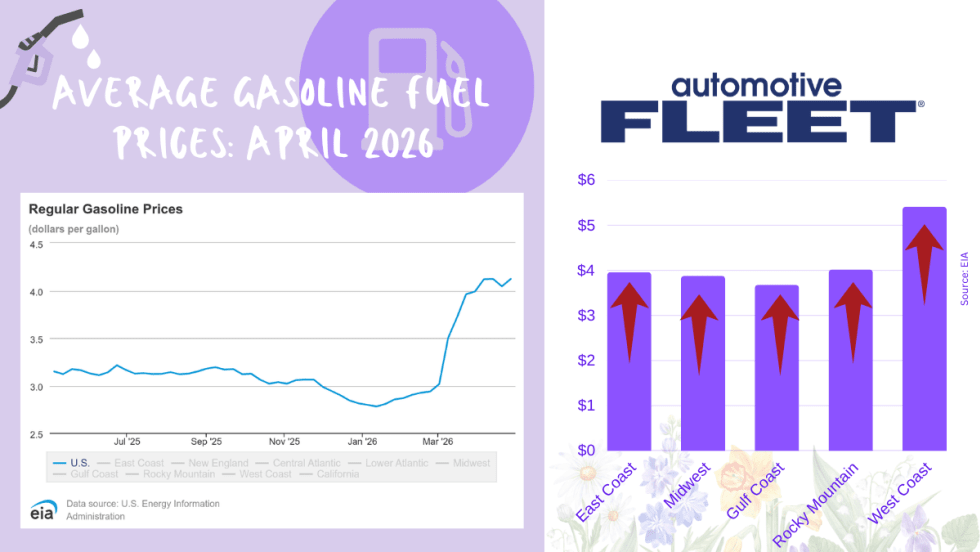
April Fuel Update: Prices Climb Above $4 as Spring Surge Accelerates
National average jumps to $4.04 per gallon, up sharply from last year, with West Coast prices topping $5 and further increases expected amid rising oil tensions.
Read More →
Tips from Fleet Managers on Saving Fuel Costs
Fleet leaders share practical strategies to reduce fuel spend through smarter policy, routing, and driver guidance.
Read More →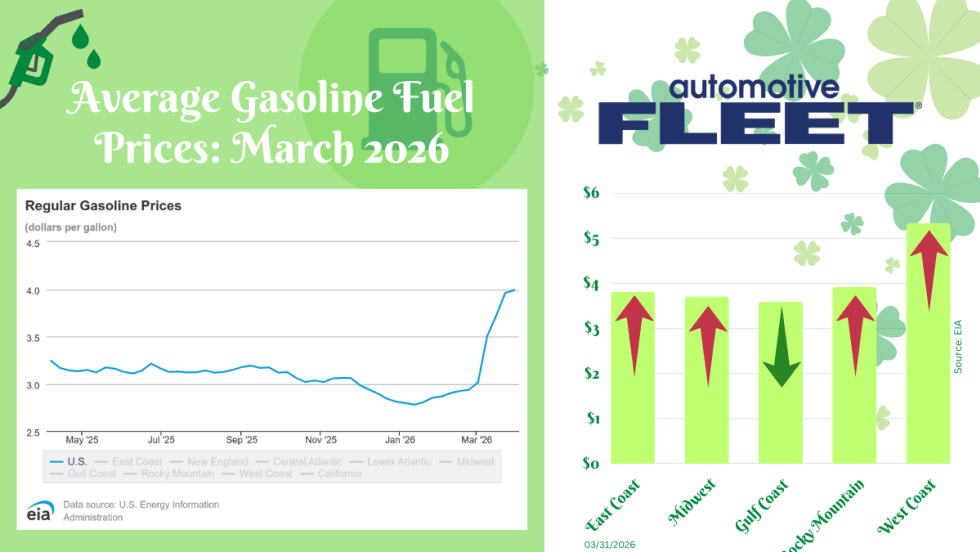
March Fuel Update: Prices Settle With a $4 Average
Fuel prices significantly slowed this week, but a $4 national average is still expected.
Read More →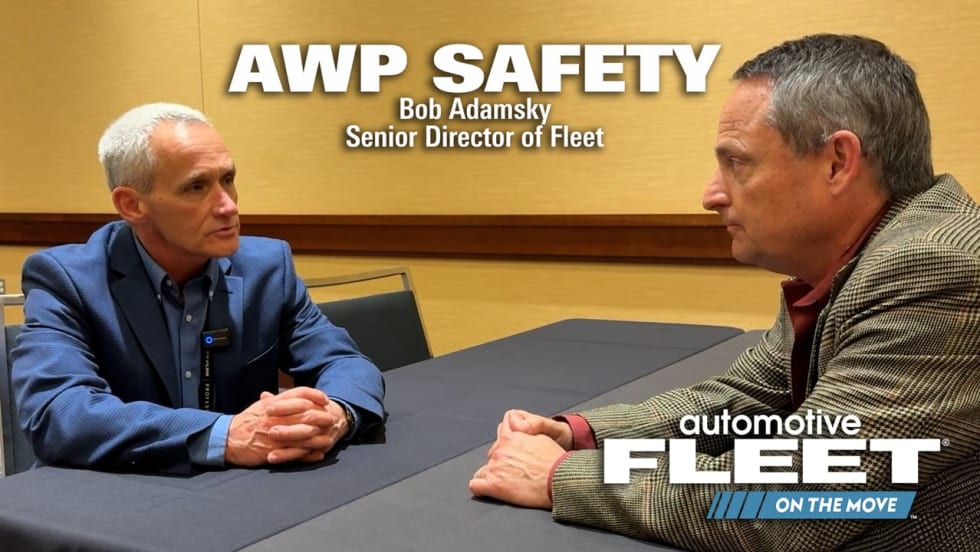
Bob Adamsky on Fuel Volatility: “Don’t Panic — Have a Plan”
With oil prices rising again, AWP Safety’s fleet manager shares how to respond to rising fuel costs and how the right strategy can turn fuel spikes into cost-saving opportunities.
Read More →
Oil Market Turbulence Is Complicating Fleet Cost Planning
Rapid swings in crude oil prices driven by the conflict in the Middle East could create longer-term cost pressures for fleets, affecting fuel prices, supply chains, and vehicle strategy, says NTEA’s Andrew Wrobel.
Read More →
Report: How AI Is Reshaping Fleet and Field Service Operations
AI is rapidly transforming fleet and field service operations, from predictive maintenance and intelligent scheduling to customer self-service and real-time diagnostics. But while organizations are seeing measurable gains in uptime, productivity, and efficiency, many are still navigating workforce adoption, cybersecurity concerns, and data readiness challenges. Explore the latest trends, investment priorities, and emerging AI use cases shaping the future of fleet operations.
Read More →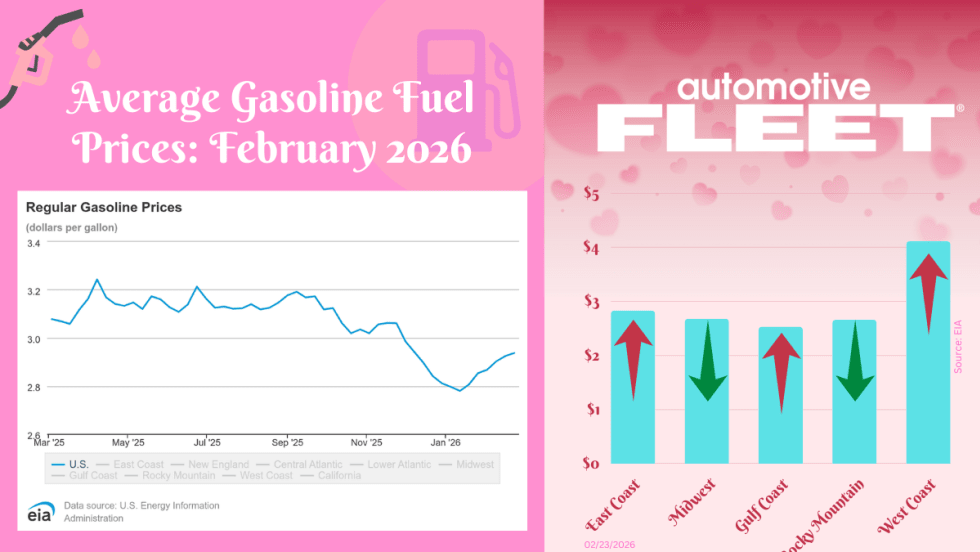
February Fuel Update: Prices Inch Higher for Third Week in a Row
The final February fuel update reveals prices continuing to inch higher for the third week in a row.
Read More →
The 2026 Fuel Economy Guide: Updated Cost and Efficiency Benchmarks for Fleets
Fleet managers can use the DOE’s 2026 Fuel Economy Guide to benchmark MPG across powertrain types using side-by-side vehicle ratings and compare new model-year options.
Read More →