


Keep Reading: Tips for Post-Flood Fleet Inspections
Hurricane Data: Analyzing Cell Connectivity, Fleet Vehicle Volumes in Florida and North Carolina
An analysis by Geotab explores how data from commercial vehicles is used to understand the impact of hurricanes on specific geographies. Patterns reveal different recovery times for North Carolina and Florida after Hurricanes Helene and Milton.
October 28, 2024
Geotab used commercial vehicle data to understand the impact extreme weather events can have on the fleet industry and overall traffic volume.
Photo: Kim Jinhong via Pexels / Automotive Fleet
3 min to read
A Geotab ITS study used data from commercial vehicles to look at the impact of hurricanes on specific regions and recovery times. Severe weather events are a logistical nightmare for fleets as managers can't plan around unknown roadblocks to perform business as usual.
While the Waffle House Index helps folks determine the intensity of impending storms, Geotab's Altitude data helps fleets understand if/when they can fully resume normal operations.
Based on three key metrics, Geotab's data shows the difference in vehicle volume patterns between Hurricane Milton in Florida and Hurricane Helene in North Carolina. The metrics are:
Device Connectivity Lag Time: This metric shows the time a Geotab GO device takes to log data, indicating network downtime due to hurricanes that caused power outages.
Roadway Vehicle Volumes: This shows the percentage of vehicles on the roadways compared to the maximum observed volume and how a storm affects recovery periods and traffic patterns.
Travel Hot Spots: This metric shows the percentage of vehicles visiting small geographic areas compared to the maximum observed vehicle count and how travel behavior changes before, during, and after a storm.
Key Findings in Two States
The metrics focus on Hurricane Helen's flooding in the Asheville, North Carolina, area and the effects of Hurricane Milton in Tampa, Florida.
Metric #1: Device Connectivity Lag Time
Geotab GO devices record a vehicle's driving activities and send the data electronically to a server. The time it takes for data to be sent from a GO device and then recorded on a server can be considered a proxy for cell connectivity.
Takeaway: During Hurricane Helene, connectivity lag times spiked in the Asheville area, and the flooding and power outages caused significant disruptions to cell service. Connectivity was still staggered in some areas days after the storm had passed.
While the Tampa area had similar connectivity lags during Milton, especially in the southeast part of the city, cell service was back to normal after the storm.
Metric #2: Roadway Vehicle Volumes
This metric shows vehicle volume as a percentage of the maximum observed volume to compare the same roadways over a week.
Takeaway: Vehicle volumes in both states dropped during the hurricanes due to a lack of mobility and road closures.
North Carolina's roadway volumes returned to normal a few days after the hurricane, but the Blue Ridge Parkway was still closed after most roads in the Asheville area were open. In Florida, traffic volumes were back to normal by Oct 14, several days after Hurricane Milton landed.
Metric #3: Travel Hot Spots
According to Geotab, this metric counts the number of vehicles that visit each sub-geography (hexagonal units covering ~98 square miles) on a given day. It calculates the ratio of vehicles on a given day to the maximum number of vehicles that have visited the same area on similar days. Essentially, comparing Wednesdays with Wednesdays.
Takeaway: In both areas, travel activity decreased before the hurricanes as residents and fleets prepared for the storms. Travel hot spots showed limited movement during the storms, increasing as roads and conditions improved.
Prepared Emergency Response for Extreme Weather
The findings demonstrate how data on connectivity, vehicle volume, and travel patterns provide valuable insight into storm severity and recovery timelines.
This information can guide fleet transportation planners and emergency managers in developing effective mitigation and response strategies to improve safety and mobility during extreme weather events.
Examples of Fluctuating Roadway Volumes
The maps show an example of vehicle volumes on the days around Hurricane Milton’s arrival in Tampa. The dates shown are October 7, 9-10, 12 and 14. October 9-10 shows the lowest overall vehicle volumes, while activity fully returns to normal by October 14.
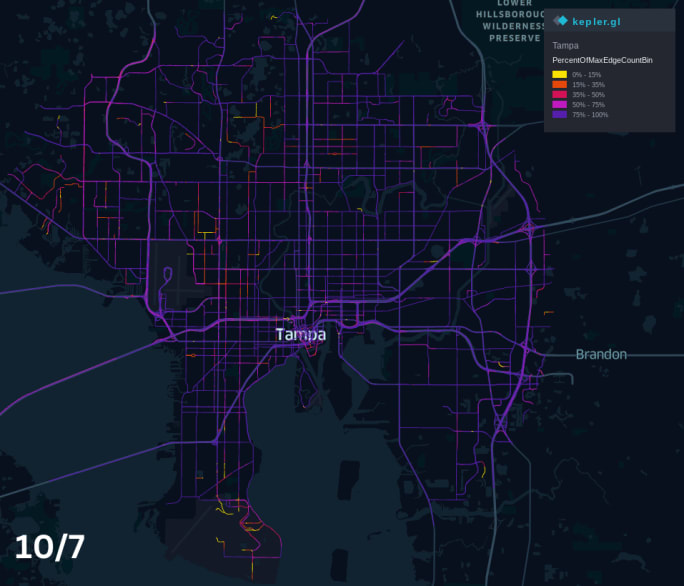
A map of Tampa, FL, on October 7, 2024, shows usual heavy vehicle volumes (75%-100%) pre-Hurricane Milton
Source: Geotab ITS
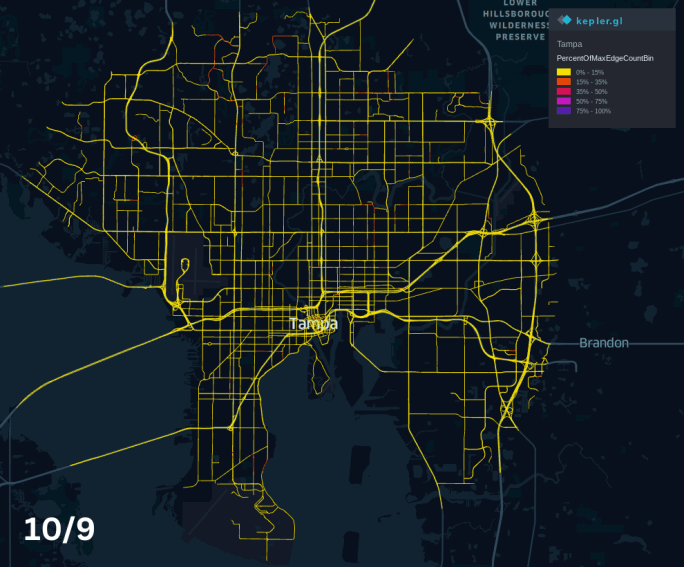
A map of Tampa, FL, on October 9, 2024, shows a majority of roadways with little to no traffic (0%-15%) as Hurricane Milton made landfall in the area.
Source: Geotab ITS
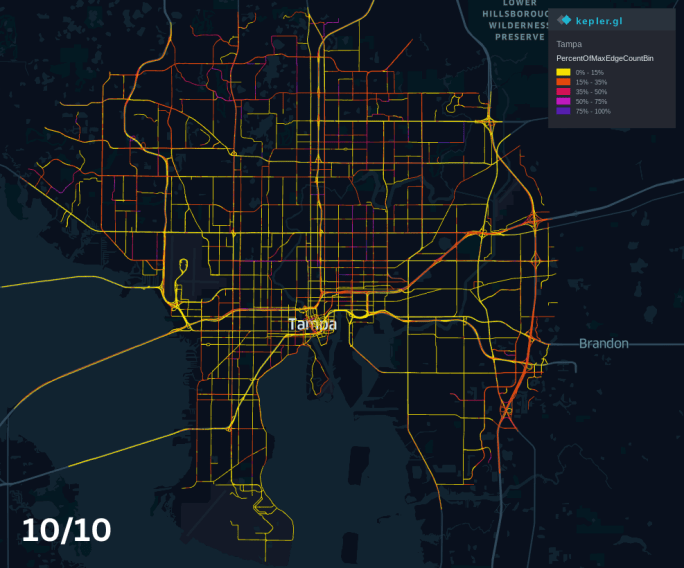
A map of Tampa, FL, on October 10, 2024, shows over half of roadways with little to no traffic (0%-15%) while some areas began returning to normal (15%-35%) post-Hurricane Milton.
Source: Geotab ITS
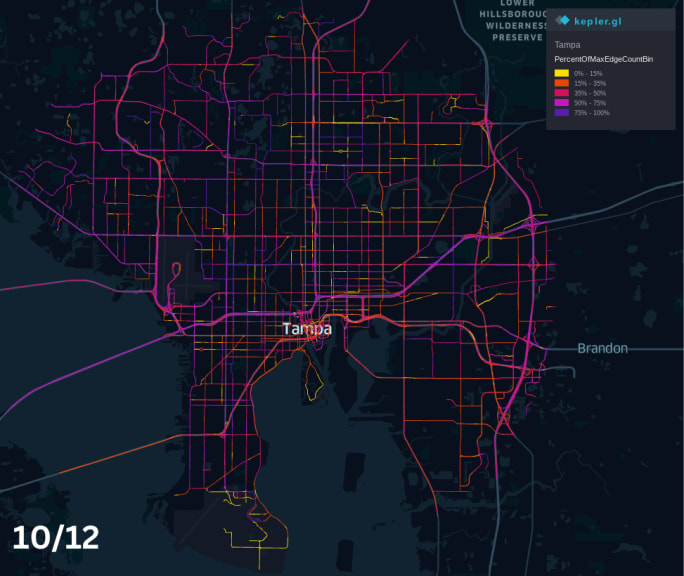
A map of Tampa, FL, on October 12, 2024, shows most roadways with moderate traffic returning (50%-75%) three days after Hurricane Milton. Some streets were still showing little to no traffic (0%-15%).
Source: Geotab ITS
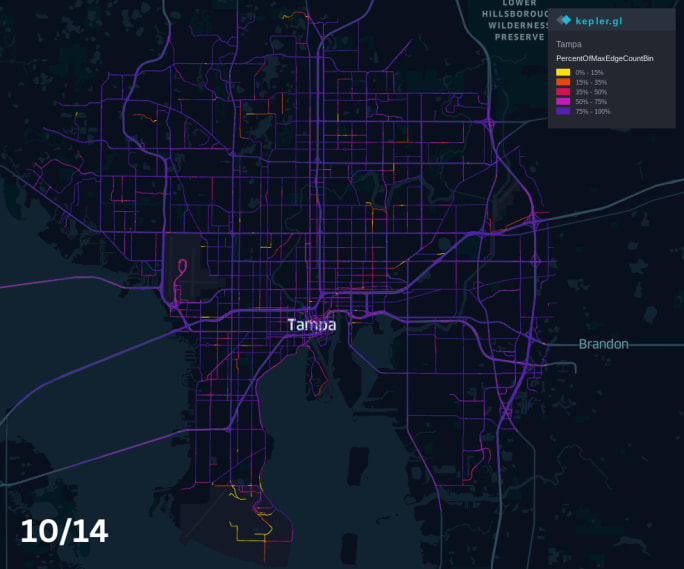
A map of Tampa, FL, on October 14, 2024, shows almost all major roadways with usual heavy vehicle volumes (75%-100%) five days after Hurricane Milton.
Source: Geotab ITS
More Telematics

Teletrac Navman Begins Next Chapter as Standalone Private Company
What's new with Teletrac Navman and its new owner?
Read More →
Why Fleets Are Creating Dedicated Fleet Analyst Positions
Telematics, AI, EVs, and connected technologies are generating more fleet data than traditional teams can effectively manage. Reed Jackson explains why dedicated fleet analytics roles are emerging to turn that information into better operational decisions.
Read More →
Deleting Driver Data Is No Longer Enough in Connected Vehicles
A factory reset may erase what's stored inside a vehicle, but it doesn't always end a former driver's digital connection. Here's how fleets can make digital offboarding part of every vehicle transition to reduce privacy, security, and compliance risks.
Read More →

How AI Can Help Fleet Managers Build Their Own Solutions
Syneos Health Fleet Manager Kristin Leary is exploring how AI-powered development tools, telematics data, and predictive analytics could help fleets solve operational challenges without waiting for a vendor roadmap.
Read More →
Sponsored•July 1, 2026
Cameras, Safety and Insurance: From Reactive Claims to Real-Time Prevention (Part 2 of 2)
Part Two: Commercial auto remains one of the most challenging and costly lines of coverage for fleet operators and insurers alike. Continue learning more about how to effectively address these issues from Onur Aksan, Enterprise Business Development Executive, Geotab
Read More →
100% Fleet Uptime? Here's Stellantis' Strategy
Keeping commercial vehicles on the road is becoming just as important as getting them into service. Stellantis’ U.S. fleet chief Michael Ferreira shares how connected technology and AI are changing the way fleets manage uptime.
Read More →
Waymo vs. Tesla Robotaxi: Side-by-Side Ride-Hailing Test Highlights Different Approaches to Autonomy
Video comparison in Austin contrasts traditional Uber service with autonomous offerings from Waymo and Tesla Robotaxi.
Read More →
Paying for a Fire Hose, Drinking from a Garden Hose: Getting the Full Value of Your Telematics
Why fleets struggle to turn telematics data into real-world results and how to fix it.
Read More →
Building Smarter Cybersecurity Policies for Fleet Operations
As fleet operations become increasingly connected, cybersecurity can no longer be treated as an IT issue alone. Building effective policies requires a proactive approach that protects vehicles, data, and operational systems while ensuring employees, vendors, and technology partners follow consistent security standards.
Read More →
Sponsored•June 1, 2026
Turning Connected Vehicle Data Into Decisions That Matter
Fleet leaders have more data than ever, but turning that data into clear, actionable decisions remains a challenge. This white paper shows how leading organizations are using connected vehicle data to improve safety, reduce costs, and optimize fleet performance. Learn how to turn insight into action across your fleet.
Read More →