

Report Highlights EV Growth, Public Charging Shortfalls
At 9.5% for 2023, EVs have reached their highest-ever sales penetration in the U.S. Yet an analysis by the Alliance for Automotive Innovation (AAI) shows the extreme disparity in the geographic distribution of EVs and charging infrastructure.

In 2023, 20% of all new charging ports were in California. However, 33% of new charging ports were located in just 1% of U.S. counties.
Photo: Canva/Automotive Fleet
Some 437 public chargers will need to be installed every day, for the next seven years — or nearly three chargers every 10 minutes through the end of 2030 — to adequately meet charging demand.
This is one of the findings from a state-by-state analysis of the U.S. electric vehicle market for the fourth quarter and full year 2023 released by the Alliance for Automotive Innovation.
The Get Connected Electric Vehicle Report summarizes EV sales and purchasing trends across all 50 states for the fourth quarter and full year of 2023.
EV Models, % Share of U.S. Total Sales
The report found that 114 EV models were available for sale in the U.S. in Q4 2023. That drove 10.2% of new light-duty vehicle sales in the fourth quarter, up from 10.1% in Q3 2023 and 8.5% in Q4 2022.
For the full year, EVs represent 9.5% of new light-duty vehicle sales, from 7% in 2022 and 4.3% in 2021. Some 377,000 EVs were sold in the U.S. in Q4 2023, a 34% increase over Q4 2022.
Public EV Charging Statistics
Not surprisingly, the report concludes that the installation of U.S. public chargers is not keeping up with current and projected EV sales. The AAI report has data to show the imbalance:
While EV sales increased 51% in 2023, the number of publicly available EV chargers increased only 27% year-over-year.
For the fourth quarter specifically, 377,383 EVs were registered in the U.S. in Q4 2023, but only 8,869 new public chargers were added — a ratio of 43 EVs for every new public port.
Overall, there are 4.3 million EVs on the road (1.5% of all light-duty vehicles in operation) and a total of 159,842 publicly available charging outlets in the U.S., for a ratio of 27 EVs for every public port.
To meet the National Renewable Energy Laboratory’s necessary infrastructure estimate for 2030, 1.2 million public chargers need to be installed by then. Put another way, 437 chargers will need to be installed every day, for the next 7 years — or nearly 3 chargers every 10 minutes — through the end of 2030.
Installed Charging Data by Geographic Area
The top 25 counties with the most public charging ports accounted for one-third of all available U.S. public chargers.
Of the more than 3,100 counties in the U.S., 31% had zero public charging ports at the end of 2023, compared to 39% in 2022. In 2023, 90 counties installed their first public charge.
In 2023, there were 33,023 new public EV chargers (22,591 Level 2 and 10,432 DC Fast) added.
12% of U.S. counties added zero new charging ports.
40% of U.S. counties added 10 or fewer charging ports.
33% of new charging ports were located in just 1% of U.S. counties.
20% of all new charging ports were in California.
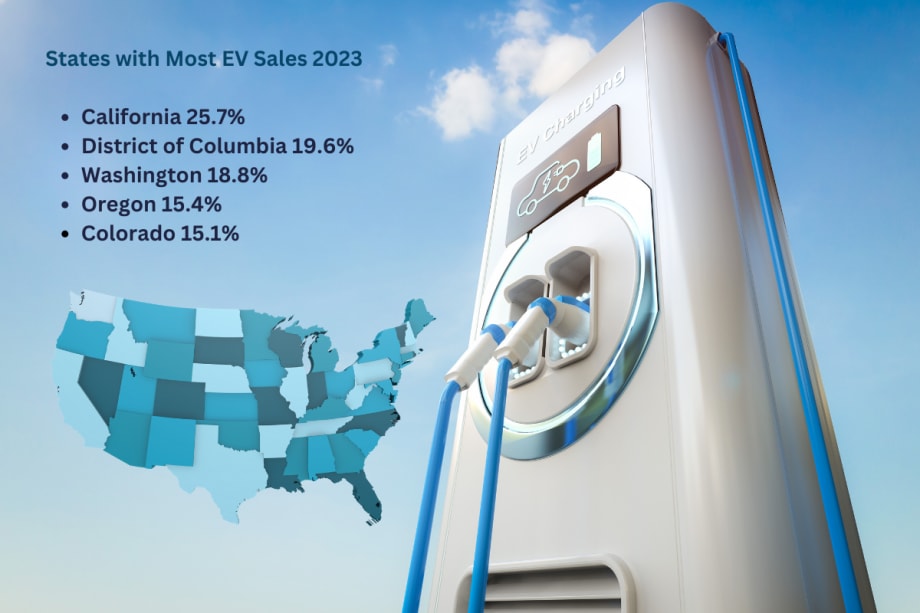
States with Most EV Sales 2023
California 25.7%
District of Columbia 19.6%
Washington 18.8%
Oregon 15.4%
Colorado 15.1%
More Fleet Forward

Fleet Forward Conference to Debut First Registration-Based Analysis of Largest Commercial Fleets
The session will deliver an exclusive first look at registration data covering more than 1.5 million commercial vehicles, offering one of the industry's most detailed views of the private fleet market.
Read More →
Registration Opens for 2026 Fleet Forward Conference
Held on the East Coast for the first time, the Washington, D.C.-area event features expert-led education, a new IIHS Crash Test Experience, and collocation with the NAFA’s Fleet Safety Symposium.
Read More →
Earley, Mossing Named to NAFA's 2026 Class of Fellows
The honor recognizes five outstanding professionals whose leadership, service and contributions have made a significant impact on NAFA and the fleet management profession.
Read More →
Fleet Forward Conference Adds IIHS Crash Test Experience for 2026 Attendees
Attendees will witness a live crash test, tour the IIHS Vehicle Research Center, and experience advanced crash-avoidance technologies firsthand.
Read More →
Cameras, Safety and Insurance: From Reactive Claims to Real-time Prevention
Commercial auto remains one of the most challenging and costly lines of coverage for fleet operators and insurers alike. Learn more about how to effectively address these issues from Onur Aksan, Enterprise Business Development Executive, Geotab.
Read More →
Matt Dyer to Deliver Closing Keynote at Fleet Forward Conference
The Merchants Fleet CEO will discuss the changing expectations and strategic role of today’s fleet leaders.
Read More →
IIHS Brings Commercial Vehicle Safety Analysis to 2026 Fleet Forward Conference Stage
IIHS President David Harkey will share early findings from new testing of delivery vans, pickups, and work trucks — and what the data means for fleet safety decisions.
Read More →
Fleet Manager or Data Strategist? You’re Both
The job hasn’t changed, but the expectations have. Do you have a plan on how to use AI to thrive?
Read More →
Nominations Are Open for the 2026 Awards!
The Hall of Fame, Visionary, and Fleet Manager of the Year award nominations are officially live. Don't miss your chance to recognize someone deserving.
Read More →
Fleet Manager of the Year Winners Over the Years
The Edward J. Bobit Fleet Manager of the Year award honors commercial fleet managers whose leadership, innovation, and business acumen have advanced the profession.
Read More →