

New York City Ranked Worst for Drivers
Due to heavy traffic and poor road conditions, New York took last place in a ranking of the best and worst U.S. cities for drivers. Two Texas cities (Lubbock and Corpus Christi) took the top spots as the most driver-friendly.

A map displaying the "Best & Worst Cities to be a Driver." Map courtesy of WalletHub.
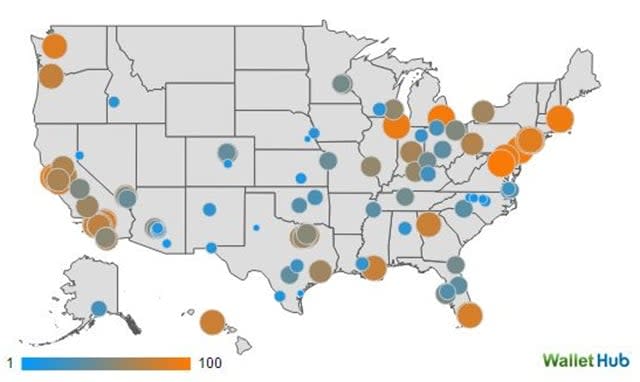
A map displaying the "Best & Worst Cities to be a Driver." Map courtesy of WalletHub.
Due to its poor traffic and road conditions, New York took last place in a recent study of the "Best & Worst U.S. Cities to Be a Driver." Texas took the top two spots (Lubbock and Corpus Christi) for the most driver-friendly cities.
Looking at the 100 most populated U.S. cities, WalletHub, a personal finance website, ranked them according to the costs of car ownership and commuting — in terms of time, money and safety.
Then WalletHub looked at these cities across 21 key metrics, including average gas prices, average annual traffic delays, rates of car theft, auto maintenance costs and parking rates. Each city was ranked by “costs,” “traffic and road conditions,” “safety” and “driver & car wellness.”
Here are the top 10 best cities to be a driver:
1) Lubbock, Texas
2) Corpus Christi, Texas
3) Lincoln, Neb.
4) Greensboro, N.C.
5) Tucson, Ariz.
6) Reno, Nev.
7) Durham, N.C.
8) Colorado Springs, Colo.
9) Winston-Salem, N.C.
10) Raleigh, N.C.
Here are the 10 worst cities to be a driver:
91) Los Angeles
92) Baltimore
93) Chicago
94) Boston
95) Newark, N.J.
96) Detroit
97) San Francisco
98) Philadelphia
99) Washington, D.C.
100) New York City
According to the study, here are some key statistics:
The average annual hours of traffic delays are six times higher in Washington than in Bakersfield, Calif.
The rate of car thefts is 27 times higher in Detroit than in Irvine, Calif.
The average gas price in Los Angeles is twice as high as those in Tucson, Ariz.
The average parking rate is 14 times more expensive in New York than in Greensboro, N.C.
Click here for the full report and to see where your city ranks.
More Safety
Managing Road Risk at Scale: Why Fleet Safety Needs a Data-Driven Framework
Insights from the FIA Road and Driver Safety Indexes reveal how to manage road risk on a larger scale.
Read More →
Stellantis Recalls 1.3 Million Jeep Vehicles Worldwide Over Fire Risk
Stellantis is recalling more than 1.3 million Jeep Wrangler and Gladiator models worldwide over a fire risk linked to power steering pump wiring.
Read More →
Coaching Is Not Training, Even When AI Is Doing It
AI-powered safety platforms can detect risky behaviors and deliver immediate feedback. But effective driver development still requires a foundation of training followed by coaching that reinforces those skills.
Read More →

How Emotions Behind the Wheel Can Affect Fleet Safety
During National Safety Month, fleets are encouraged to look beyond distracted driving and recognize how stress, fatigue, and emotional well-being influence driver performance and crash risk.
Read More →
Nominations Open for 2026 Fleet Safety Award
Nominations have officially opened for the 2026 Fleet Safety Award Winner.
Read More →
Turning Connected Vehicle Data Into Decisions That Matter
Fleet leaders have more data than ever, but turning that data into clear, actionable decisions remains a challenge. This white paper shows how leading organizations are using connected vehicle data to improve safety, reduce costs, and optimize fleet performance. Learn how to turn insight into action across your fleet.
Read More →
Cameras, Safety and Insurance: From Reactive Claims to Real-time Prevention
Commercial auto remains one of the most challenging and costly lines of coverage for fleet operators and insurers alike. Learn more about how to effectively address these issues from Onur Aksan, Enterprise Business Development Executive, Geotab.
Read More →
NAFA Fleet Safety Symposium to Collocate With 2026 Fleet Forward Conference
The daylong certificate program will precede the Fleet Forward Conference at the Gaylord National Harbor in Maryland.
Read More →
The Distractions You Can’t Turn Off: What Drivers Face Outside the Vehicle
Fleet drivers face constant visual, cognitive, and environmental interruptions the moment they hit the road. From roadside chaos to mental fatigue and digital overload, today’s biggest driving risks often come from outside the vehicle itself.
Read More →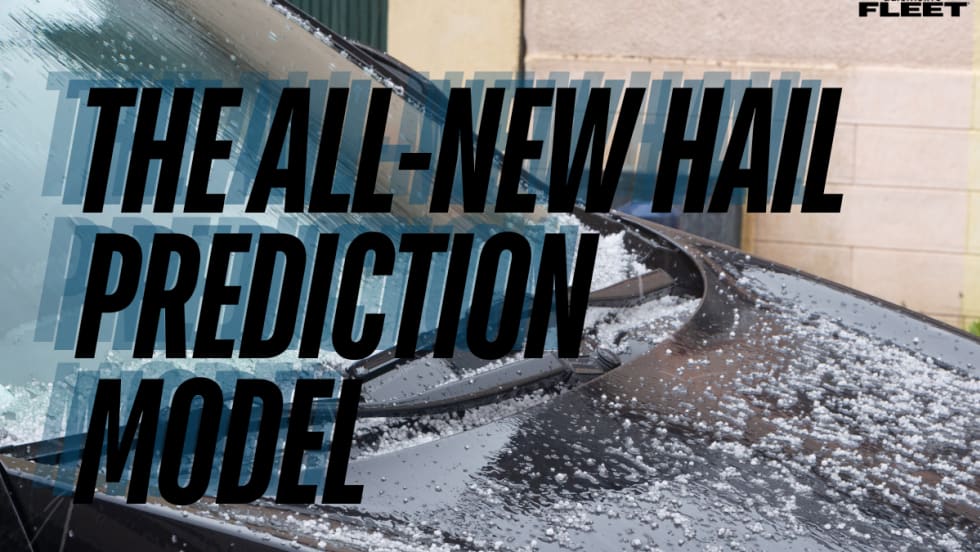
FLASH Weather AI Launches First Deep-Learning Hail Prediction Model With High-Resolution Forecasting
FLASH Weather AI has launched a first-of-its-kind hail prediction model capable of forecasting hail size and arrival time at 1-kilometer resolution up to 55 minutes ahead, giving fleets and insurers critical time to prepare for severe storms.
Read More →