

New EPA Report Details 2012 Nationwide Fuel Economy Improvements
The U.S. EPA's report found that between 2007 and 2012, fuel economy values increased by 16% whereas CO2 emissions decreased by 13%.
The U.S. Environmental Protection Agency (EPA) released its latest annual report that tracks the fuel economy of vehicles sold in the U.S. The report found that between 2007 and 2012, fuel economy values increased by 16% whereas CO2 emissions decreased by 13%. In 2012 alone, fuel economy improved 1.4 mpg, which increased the average vehicle fuel economy to 23.8 mpg. The report details the different trends that are driving the increase in fuel economy, from new technologies to manufacturers’ efforts and government regulations (corporate average fuel economy, or CAFE, standards).
Some of the technologies that are driving this improvement, largely driven by manufacturers’ efforts to build more fuel-efficient vehicles, are engine technologies, such as variable valve timing and direct injection and improved transmission technology. EPA said variable valve and multi-valve timing will be on 90% of all MY-2012 vehicles. Also, in MY-2007, direct injection technology was used on nearly zero vehicles and in 2012 it was on 24% of vehicles. Vehicle lightweighting efforts, although discussed more recently by various automakers, hasn’t kicked in yet, according to the report. MY-2011 vehicle weight was an average of 4,127 lbs., which is up 125 lbs. from 2010, but in 2012, EPA is projecting that vehicle weight could decrease or remain flat.
Regarding regulatory standards, CAFE standards for MY-2012 require compliance of roughly 29.3 mpg, though actual requirements depend on vehicle footprint levels, EPA stated. By MY-2016, the CAFE standard will be 34.1 mpg, and by 2025, EPA is projecting average industry-wide compliance levels of 48.7 to 49.7 mpg. EPA said the reason for the lower requirement level is tied to CO2 emissions requirements. If automakers are able to reduce emissions by the required amount (to 163 g/mi by 2025) through fuel-economy improvements alone, corporate average fuel economy would equal 54.5 mpg. If automakers are able to achieve emission reductions through other means (for example by reducing vehicle air-conditioning system leaks), this would mean automakers achieved a lower fuel-economy level of the previously mentioned 48.7 to 49.7 mpg.
For 2012, EPA said the larger improvement in fuel economy, compared to previous years, is partially due to the earthquake and tsunami in Japan affecting production of units by Japanese automakers, for example Toyota and Honda, according to the report. If those automakers had been able to sell more units in 2011, the EPA stated that the increase in mpg between 2011 and 2012 would have been greater.
Another factor that has improved fuel economy in general has to do with sales of trucks and SUVs, which have been particularly volatile over the last few years due to higher fuel prices and generally uncertain economic conditions in the U.S.
The EPA said it expects fuel economy to continue to improve due to the corporate average fuel economy standards (CAFE) set to gradually increase to the higher required average (163 g/mi, which would mean 54.5 mpg, if the C02 reductions are achieved via fuel-economy improvements alone, as previously mentioned).
The report on 2012 fuel economy also features a new section on vehicles that operate on alternative fuels. The report also said that compared to five years ago, there are twice as many hybrid and diesel passenger vehicle choices available, a selection of plug-in hybrids, and a six-fold increase in the number of vehicles that achieve a combined miles-per-gallon rating of 30 or better.
You can read the EPA's report here.
More Fuel
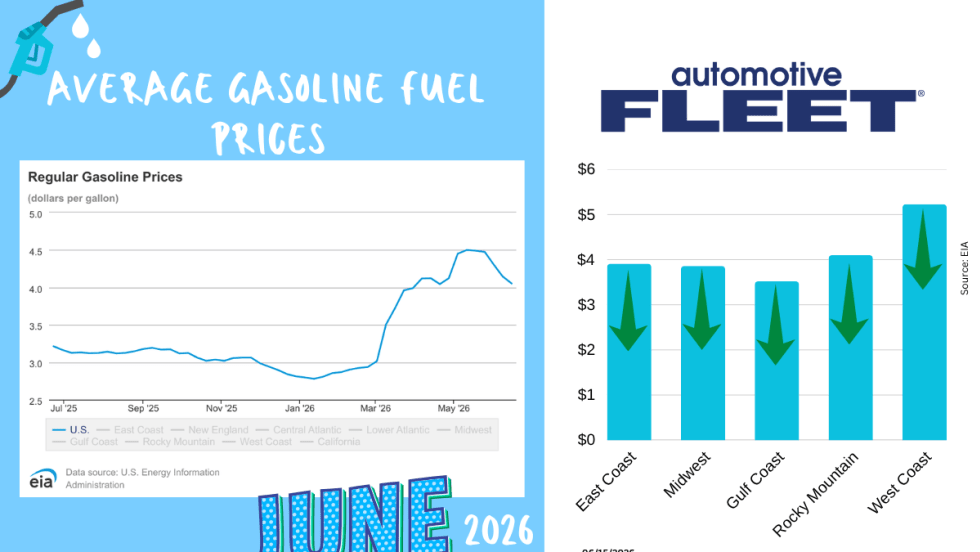
June Fuel Update: Prices Fall Below $4
Drivers are finally getting some relief at the pump. The national average gas price has dropped below $4 a gallon for the first time in months, with prices falling in 47 states as oil markets react to developments in U.S.-Iran negotiations.
Read More →
Study: How 2026's Gas Price Hikes Affect Different Vehicle Types
New data from iSeeCars reveals how rising fuel costs have affected different vehicle segments as gasoline prices climbed nearly 46% over the past four months.
Read More →Are You Tracking Your Fleet's True Total Cost of Ownership?
Bobit Business Media surveyed 190 fleet professionals and found that while most fleets are tracking costs, fragmented systems and data gaps are keeping true TCO visibility out of reach. With rising pressure to control spend in an increasingly volatile environment, the gap between what fleets think they know and what the data actually shows is wider than you might expect. See how your peers are managing costs today and where the industry still has room to improve.
Read More →
May Fuel Update: All Regions Experience Declines
Gas prices are finally easing in much of the country, but experts warn global tensions could quickly reverse the trend as the national average remains well above last month’s levels.
Read More →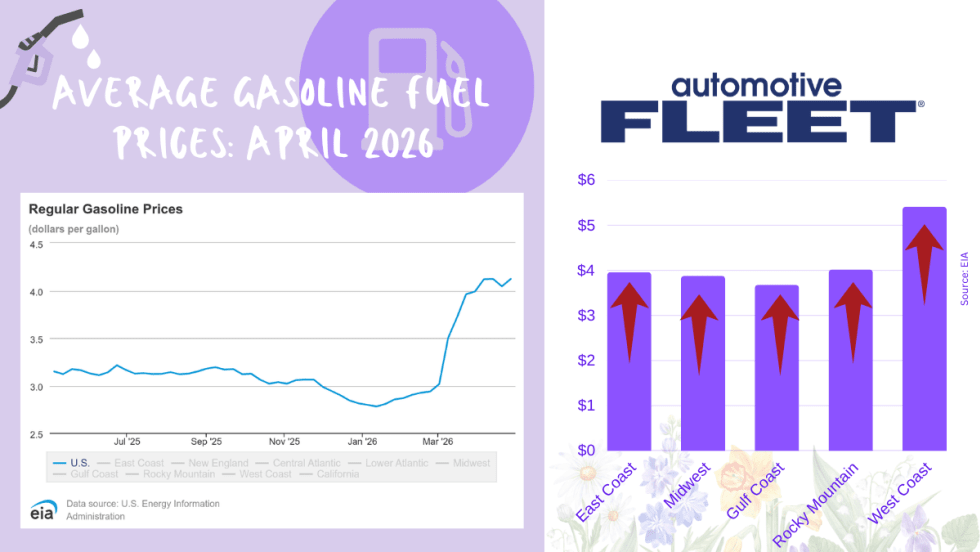
April Fuel Update: Prices Climb Above $4 as Spring Surge Accelerates
National average jumps to $4.04 per gallon, up sharply from last year, with West Coast prices topping $5 and further increases expected amid rising oil tensions.
Read More →
Tips from Fleet Managers on Saving Fuel Costs
Fleet leaders share practical strategies to reduce fuel spend through smarter policy, routing, and driver guidance.
Read More →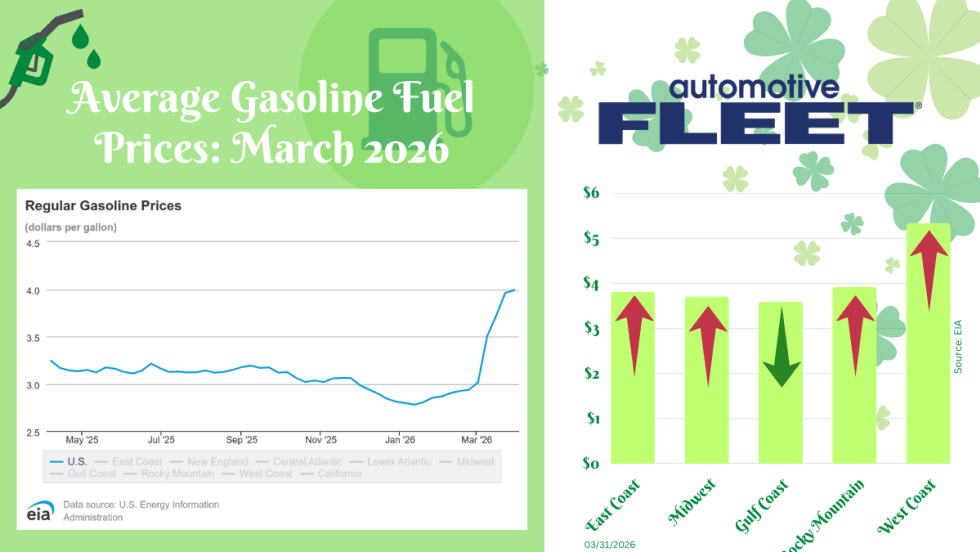
March Fuel Update: Prices Settle With a $4 Average
Fuel prices significantly slowed this week, but a $4 national average is still expected.
Read More →
Bob Adamsky on Fuel Volatility: “Don’t Panic — Have a Plan”
With oil prices rising again, AWP Safety’s fleet manager shares how to respond to rising fuel costs and how the right strategy can turn fuel spikes into cost-saving opportunities.
Read More →
Oil Market Turbulence Is Complicating Fleet Cost Planning
Rapid swings in crude oil prices driven by the conflict in the Middle East could create longer-term cost pressures for fleets, affecting fuel prices, supply chains, and vehicle strategy, says NTEA’s Andrew Wrobel.
Read More →
February Fuel Update: Prices Inch Higher for Third Week in a Row
The final February fuel update reveals prices continuing to inch higher for the third week in a row.
Read More →