

Netradyne RiskMap Identifies Risks on Specific Routes
Netradyne has announced a new feature for analyzing driver risks based on the route called Driveri RiskMap, allowing fleet managers to visualize a more complete picture of fleet behavior.
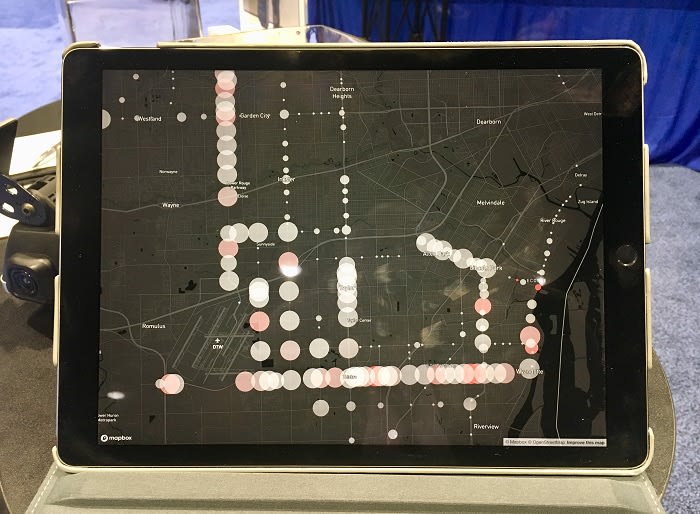
RiskMap shows degree of risk for traffic lights or speed on a given road. The larger the circle, the greater the volume of risk. The redder the circle, the more severe the risks. Photo: David Cullen

RiskMap shows degree of risk for traffic lights or speed on a given road. The larger the circle, the greater the volume of risk. The redder the circle, the more severe the risks.Photo: David Cullen
Netradyne has announced a new feature for analyzing driver risks based on the route called Driveri RiskMap, allowing fleet managers to visualize a more complete picture of fleet behavior.
The RiskMap mapping feature recognizes and clusters specific driver behaviors which represent favorable or risky situations for the driver, fleet, or general public. This allows managers to review and evaluate risk areas and modify fleet operations and routes to increase safety or all parties involved.
“It will be a value-added option to the Netradyne Driveri when released, which will be soon,” said Adam Kahn, vice president, fleets for Netradyne. “The aim is to help fleets identify risks on the road that can impact safety and efficiency.”
In addition to identifying potentially dangerous roads, Driveri RiskMap utilizes Driveri's data visualization tool to communicate other unfavorable road conditions such as heavy traffic congestion, reduced following distance, dangerous intersections, speed relative to traffic, and incidents of vehicle damage so managers and drivers can efficiently plan their daily routes.
Fleets can use the information to identify and prioritize risks associated with their business and recognize safer roads so they can be used more often.
"We can now offer our fleet community visibility into geographic areas with the highest risk factors and those that are conducive to safe driving. Legacy safety technologies only collect a small amount of 'triggered' data, which makes them unable to identify data visualization trends." said Kahn. "Driveri RiskMap utilizes several hundred minutes of data captured and analyzed per vehicle per day, providing a deep understanding of geographic areas to focus on."
More Safety

Top 50 Executive Fleets
It is that time of year again! Time for the 2026 list of the Top 50 Executive Fleets, presented by Automotive Fleet and Volvo as part of its annual Fleet 500. Download now to see this year's list of companies!
Read More →
How Better Visibility Cut Speeding Violations by 48%
Fleet leaders don't need more data, they need clearer visibility into what the data is saying. This case study explores how one utility replaced speeding-event counts with a single metric — miles driven in violation — to strengthen safety and significantly reduce speeding violations.
Read More →
Operation Safe Driver Week: Why the Industry's Oldest Safety Campaign Still Matters to Fleets
A look at how a 2007 enforcement initiative became one of the most consequential weeks on the fleet safety calendar, and what it means for your drivers in 2026.
Read More →
Nexar-Nauto Merger Aims to Give Fleets Better Safety Intelligence Through Larger Driving Dataset
Stefan Heck tells Automotive Fleet that combining more than 10 billion miles of driving history with Nexar's AI models will give fleets deeper insights into driver risk and roadway conditions than either company could provide independently.
Read More →
From Silos to Solutions: Relationship Management for Safer Fleets
From telematics adoption and driver accountability to policy consistency and risk mitigation, this episode breaks down what it really takes to build a safer fleet culture without slowing business down.
Read More →
IIHS Launches First Commercial Vehicle Safety Evaluations
The Insurance Institute for Highway Safety has begun evaluating heavy-duty pickups and cargo vans for driver protection. Which models earned top marks?
Read More →
Reducing Risk by Eliminating Phone Use Behind the Wheel
Hosted with the cofounder of Lifesaver Mobile, this episode addresses phone use behind the wheel and how to design a driving environment that actually helps prevents accidents.
Read More →
Cameras, Safety and Insurance: From Reactive Claims to Real-Time Prevention (Part 2 of 2)
Part Two: Commercial auto remains one of the most challenging and costly lines of coverage for fleet operators and insurers alike. Continue learning more about how to effectively address these issues from Onur Aksan, Enterprise Business Development Executive, Geotab
Read More →
How 5-Second Telematics Data Is Changing Fleet Safety
This episode connects with Steve Santostasi of Ford Pro and covers how a few seconds of data can make a difference in fleet safety.
Read More →
The Two Biggest Summer Downtime Threats for Fleets
A conversation with a maintenance expert reveals the two most common summer maintenance pains and how to prevent them.
Read More →