




More Than 54K Bridges Structurally Deficient: DOT Data
U.S. bridges currently rated as structurally deficient — if placed end-to-end — would stretch 1,216 miles, according to a new analysis of 2017 federal data on bridges.

A total of 54,259 of the nation’s bridges are rated "structurally deficient," and vehicles cross these compromised structures 174 million times every day, according to a newly released analysis of the U.S. Department of Transportation’s 2017 bridge inventory database.
The analysis, released by the American Road and Transportation Builders Association (ARTBA), noted that these structurally deficient bridges — if placed end-to-end — would stretch 1,216 miles. That’s nearly the distance between Miami and New York City. The average age of a structurally deficient bridge is 67 years, compared to 40 years for non-deficient bridges.
The 1,800 structurally deficient-rated bridges that are a part of the Interstate Highway System are crossed 60 million times daily, according to ARTBA.
To help ensure public safety, bridge decks and support structures are regularly inspected. They are rated on a scale of zero to nine, with nine meaning the bridge is in excellent condition. A bridge is classified as structurally deficient and in need of repair if the rating on a key structural element is four or below. While these bridges may not be imminently unsafe, they are in need of attention.
Iowa (5,067), Pennsylvania (4,173), Oklahoma (3,234), Missouri (3,086), Illinois (2,303), Nebraska (2,258), Kansas (2,115), Mississippi (2,008), North Carolina (1,854) and New York (1,834) have the highest number of structurally deficient bridges, according to the analysis. The District of Columbia (8), Nevada (31), Delaware (39), Hawaii (66), and Utah (87) have the fewest.
At least 15% of the bridges in six states — Rhode Island (23%), Iowa (21%), West Virginia (19%), South Dakota (19%), Pennsylvania (18%) and Nebraska (15%) — fall in the category of structurally deficient.
The pace of improving the nation’s inventory of structurally deficient bridges slowed this past year, ARTBA said. But it’s down only two-tenths of a percent from the number reported in the government’s 2016 data. At the current pace of repair or replacement, fixing all of them would take 37 years, said Dr. Alison Premo Black, ARTBA chief economist.
For the Top 10 list of most-traveled deficient bridges by state, click here.
For state-by-state rankings, click here.
More Safety

The Safest Fleets Aren’t the Ones with the Most Technology
You’ve made the telematics investment. Here’s how to capture the other half of its value and build the safest fleet on the road.
Read More →
Hidden in Plain Sight: Fleet Compliance Risks
Fleet compliance isn't just about having policies — it's about consistently enforcing them. This practical guide reveals six hidden compliance risks common in public sector and shared fleet operations and outlines proven strategies to improve visibility, accountability, and audit readiness
Read More →
NETS Sets 2026 Fleet Safety Benchmark Conference for Indianapolis
The Sept. 15–17 program will feature fleet benchmarking data, case studies, emerging technologies, and implementation strategies while running alongside the NSC Safety Congress & Expo.
Read More →
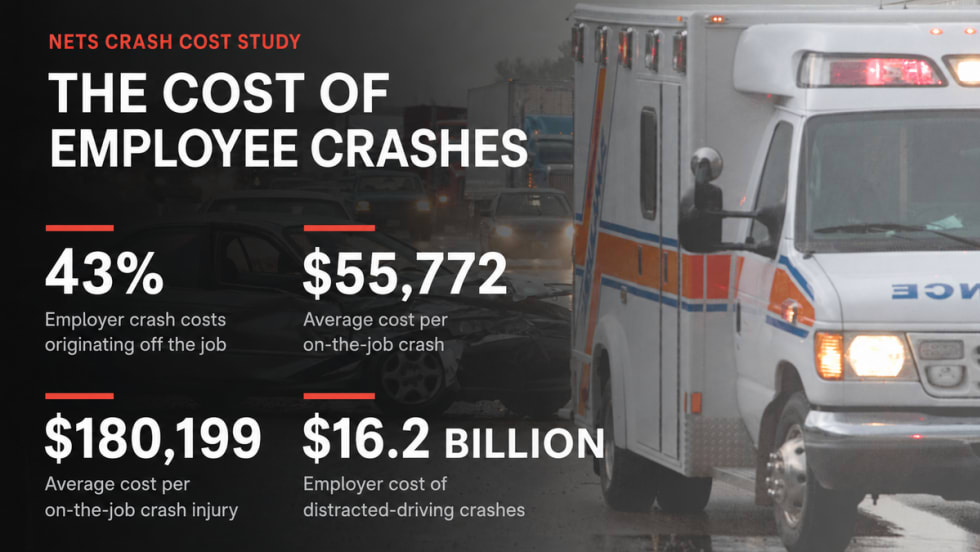
Off-the-Job Crashes Account for 43% of Employers’ $61.7 Billion Crash Burden
NETS quantifies costs dispersed across fleet, risk, HR, and other departments while providing new per-crash benchmarks for employers.
Read More →
Ram Recalls More Than 1.27 Million 1500 Pickups for Seat Belt Anchor Issue
The recall affects certain 2019-2026 Ram 1500 pickups that may have improperly attached second-row seat belt buckle anchors.
Read More →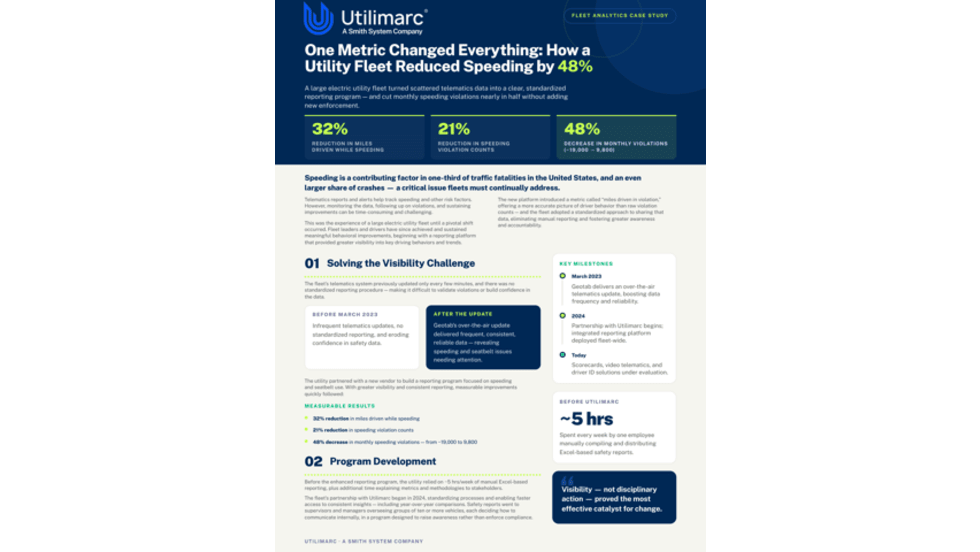
How Better Visibility Cut Speeding Violations by 48%
Fleet leaders don't need more data, they need clearer visibility into what the data is saying. This case study explores how one utility replaced speeding-event counts with a single metric — miles driven in violation — to strengthen safety and significantly reduce speeding violations.
Read More →
Operation Safe Driver Week: Why the Industry's Oldest Safety Campaign Still Matters to Fleets
A look at how a 2007 enforcement initiative became one of the most consequential weeks on the fleet safety calendar, and what it means for your drivers in 2026.
Read More →
Nexar-Nauto Merger Aims to Give Fleets Better Safety Intelligence Through Larger Driving Dataset
Stefan Heck tells Automotive Fleet that combining more than 10 billion miles of driving history with Nexar's AI models will give fleets deeper insights into driver risk and roadway conditions than either company could provide independently.
Read More →
From Silos to Solutions: Relationship Management for Safer Fleets
From telematics adoption and driver accountability to policy consistency and risk mitigation, this episode breaks down what it really takes to build a safer fleet culture without slowing business down.
Read More →
IIHS Launches First Commercial Vehicle Safety Evaluations
The Insurance Institute for Highway Safety has begun evaluating heavy-duty pickups and cargo vans for driver protection. Which models earned top marks?
Read More →