




Indigenous, Black People Most Likely to Die in Traffic Collisions
The authors assert that ethnicity and race are intertwined with other factors that affect collision risk, like socioeconomic status and overall investments in crash prevention in certain communities

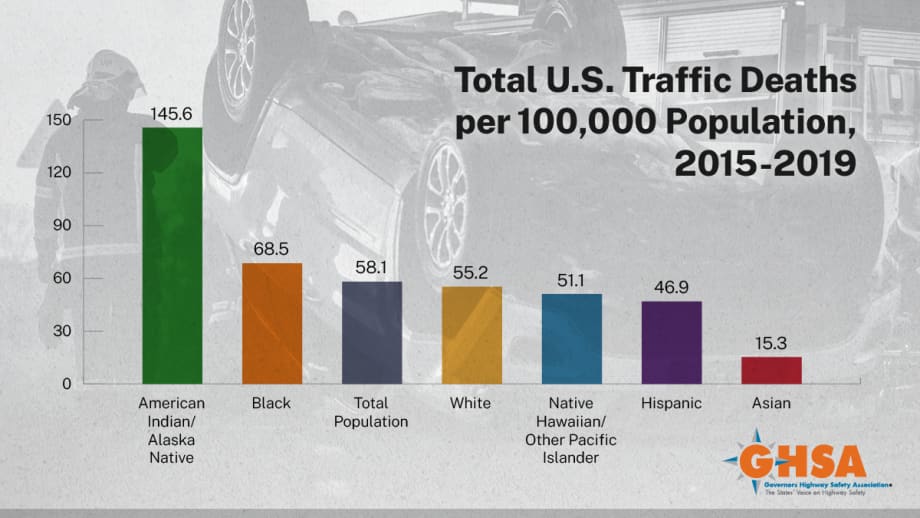
The report analyzes data for the five-year period 2015-2019 and finds that traffic crash fatalities disproportionately affect Black, Indigenous and People of Color (BIPOC).
Infographic courtesy of GHSA.
Compared with all other racial groups, American Indian/Alaskan Native persons experienced a substantially higher per-capita rate of total traffic fatalities and Black persons had the second highest rate of total traffic deaths in recent years, according to a new analysis from the Governor’s Highway Safety Association.
The report analyzes data for the five-year period 2015-2019 and finds that traffic crash fatalities disproportionately affect Black, Indigenous and People of Color (BIPOC). The authors also address actions for addressing equity in traffic safety.
American Indian/Alaskan Natives also had the highest rate of speeding-related fatalities, and pedestrian and bicyclist deaths. Black persons not only had the second highest rate of total traffic fatalities but also the second highest rate of pedestrian traffic deaths and bicyclist traffic deaths.
Asian persons had the lowest rate of involvement for virtually all categories of traffic deaths. White persons generally have lower fatality rates then BIPOC according to the report, with the exceptions being motorcycle driver and passenger deaths.
The authors put forth the premise that ethnicity and race are intertwined with other factors that affect collision risk, like socioeconomic status and overall investments in crash prevention in certain communities. For example, there are likely disparities in roadway infrastructure, traffic enforcement, and traffic safety education depending on any given community’s location or economic health.
Other noteworthy findings from the report include the fact that American Indian/Alaskan Native persons had the highest rate of nighttime traffic fatalities. This could be due to the amount of streetlight illumination provided in underserved communities versus affluent neighborhoods, note the authors.
The report also examines he connection between race, police relations, and motor vehicle deaths. Here again, American Indian/Alaskan Native and Black persons experienced the first and second highest rates of traffic deaths involving police pursuits while behind the wheel.
An important key finding from previous research but mentioned in the new report concerns Black children ages 4-15. This population had the highest rates of fatalities involving pedestrians and other people not in vehicles as a percentage of all motor vehicle traffic deaths
More Safety
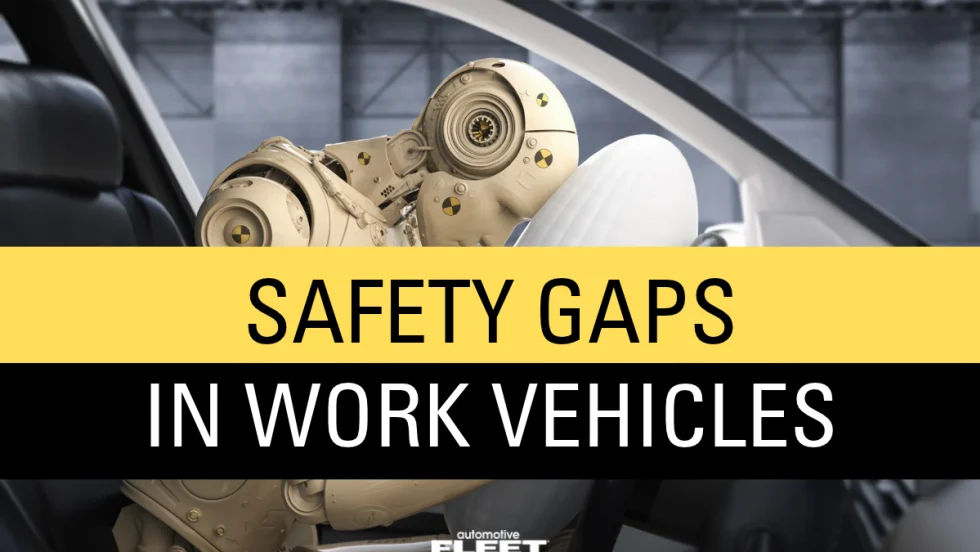
IIHS Crash Avoidance Tests Reveal Safety Gaps in Cargo Vans and Work Trucks
New crash-avoidance ratings from the Insurance Institute for Highway Safety reveal inconsistent performance among commercial vehicles, with several popular cargo vans and heavy-duty pickups struggling to avoid collisions with other vehicles and pedestrians.
Read More →
What’s Next for Fleet? Safety, AI & Industry Recognition | AF News Recap
Could your company's culture be encouraging distracted driving? This week, we're exploring how workplace expectations affect driver safety, what AI, EVs, and autonomous vehicles could mean for the future of fleet management, and how fleet professionals can strengthen their award nominations.
Read More →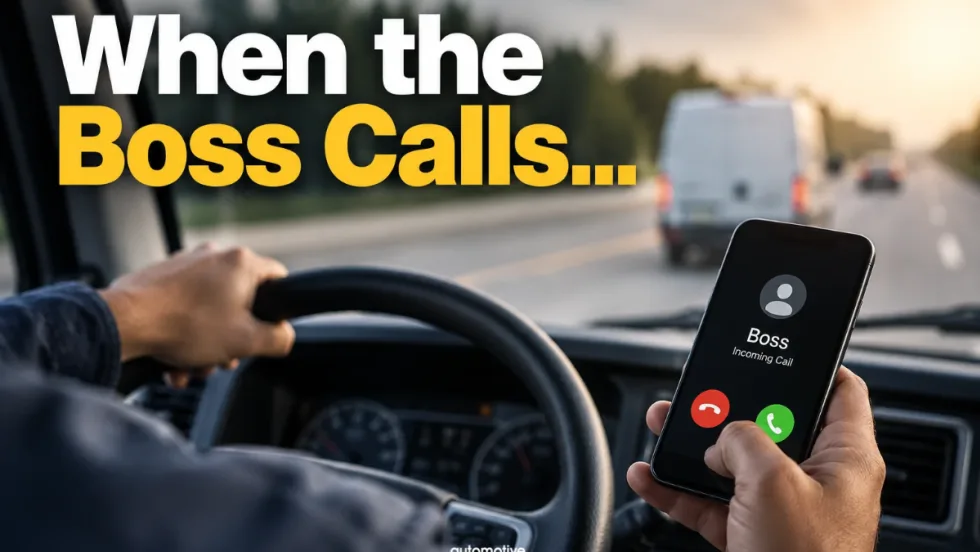
Does Your Fleet's Culture Encourage Distracted Driving?
What happens when the people responsible for enforcing safety rules are the ones setting the wrong example? The answer may reveal why some of the biggest risks to fleet drivers have little to do with what's written in the employee handbook.
Read More →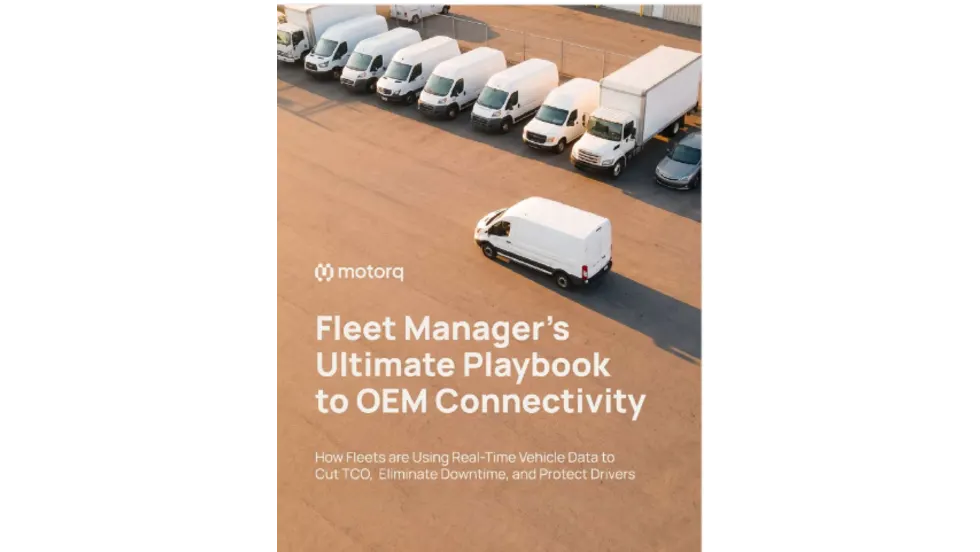
Fleet Manager’s Ultimate Playbook: Navigating the New Standard in OEM Connectivity
Rising operating costs, driver safety concerns, and unplanned downtime are putting unprecedented pressure on modern fleets. Discover how fleet managers use embedded OEM connectivity and real-time vehicle data to cut TCO, prevent downtime, and protect drivers without aftermarket telematics hardware.
Read More →
From Driver Well-Being to EV Charging | AF News Recap
Mental health belongs in the fleet safety conversation. This week, we’re looking at five ways fleets can support employee well-being before a crisis, plus Holman’s expansion in Mexico, new one-day Fleet Forward passes, and why EV charging demand is outpacing infrastructure growth.
Read More →
Nexar-Nauto Merger Aims to Give Fleets Better Safety Intelligence Through Larger Driving Dataset
Stefan Heck tells Automotive Fleet that combining more than 10 billion miles of driving history with Nexar's AI models will give fleets deeper insights into driver risk and roadway conditions than either company could provide independently.
Read More →
Don't Wait for a Crisis: 5 Ways to Build Mental Health Into Your Fleet Safety Program
For Suicide Prevention Month, fleet and safety leaders have an opportunity to put mental health where it belongs: at the center of workplace safety.
Read More →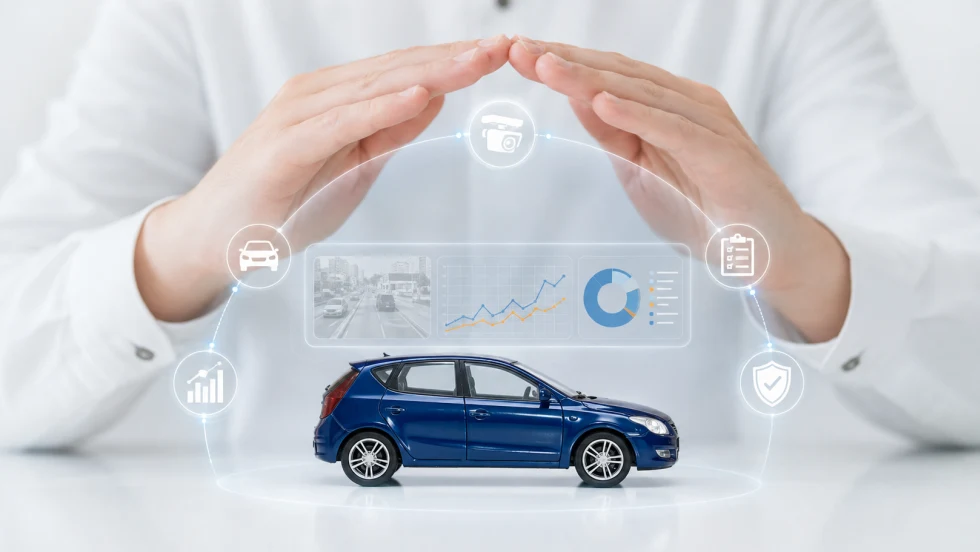
How Camera Data Can Strengthen a Fleet’s Insurance Renewal
Insights from a commercial insurance carrier and a broker show how fleets can turn video telematic data, driver coaching, and improved claims results into a stronger case at insurance renewal.
Read More →
The Safest Fleets Aren’t the Ones with the Most Technology
You’ve made the telematics investment. Here’s how to capture the other half of its value and build the safest fleet on the road.
Read More →
Hidden in Plain Sight: Fleet Compliance Risks
Fleet compliance isn't just about having policies — it's about consistently enforcing them. This practical guide reveals six hidden compliance risks common in public sector and shared fleet operations and outlines proven strategies to improve visibility, accountability, and audit readiness
Read More →