




Related: Atlanta's Spaghetti Junction Tops ATRI's List of Truck Bottlenecks for 2015
Highway Users Rank America's Worst 50 Traffic Bottlenecks
The worst traffic bottleneck in the country is in Chicago, Ill., according to a new study by the American Highway Users Alliance -- and Los Angeles owns the next six of the top 10.
by Staff
November 23, 2015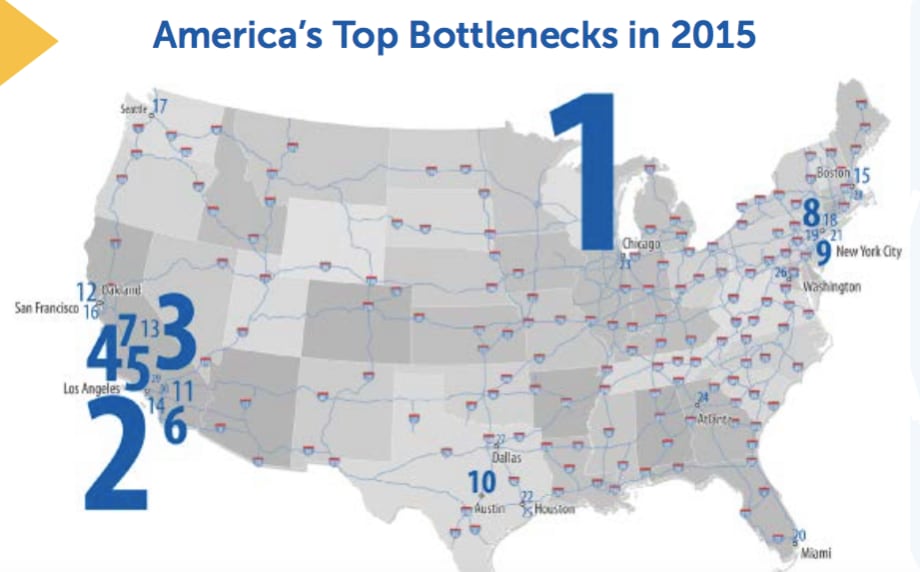
4 min to read
The worst traffic bottleneck in the country is in Chicago, Ill., according to a new study by the American Highway Users Alliance -- and Los Angeles owns the next six of the top 10.
In the top-ranked Chicago chokepoint, on the Kennedy Expressway (I-90) between the Circle Interchange (I-290) and Edens junction (I-94), the bottleneck was found to extend 12 miles, costing motorists 16.9 million hours' worth of time, equivalent to $418 million in 2014. More than 6.3 million gallons of fuel is wasted on I-90 while cars idle or crawl in traffic. By just fixing America's worst bottleneck, an annual reduction of 133 million pounds of carbon dioxide emissions would also be likely, the study found.
Besides identifying and ranking the nation's 50 worst traffic bottlenecks, the study, Unclogging America's Arteries 2015, examines the top 30 chokepoints closely and details many of the major benefits that will accrue to society by fixing them. In addition to improving mobility and quality of life for motorists, fixing the top 30 bottlenecks alone would, over 20 years:
Save $39 billion due to lost time,
Save 830 million gallons of fuel,
Reduce over 17 billion pounds of greenhouse gas emissions (CO2), and
Prevent 211,000 vehicle crashes
"This report furthers the unassailable truth that America is stuck in traffic," said Transportation Secretary Anthony Foxx, speaking at the press conference announcing the survey results. "The good news is that this problem is solvable, and Congress can be part of the solution. As a long-term surface transportation bill moves through conference, I urge our elected leaders to provide the funding growth and policies that are necessary to improve commutes, to raise the bar for safety, and to keep the country moving in the 21st century."
Bill Graves, who is chairman of the Highway Users and president and CEO of the American Trucking Associations, called the study "a huge reminder of the very high costs of neglecting our nation's transportation infrastructure. We hope this report will be one more huge wake-up call to our nation's leaders about the importance of addressing our critical highway needs.
"These bottlenecks cost our economy billions with the delays they cause moving our nation's freight. They are truckers' worst nightmares come true, but one that tens of thousands of our nation's freight haulers have to deal with daily," Graves said.
The study's top 50 list includes trouble spots in the following metropolitan areas: 12 in Los Angeles, nine in and around New York City, three in Chicago, three near Washington DC, three in Houston, three in Boston, three in Dallas, three in Miami, two in Atlanta, two in Philadelphia, and two in San Francisco/Oakland.
Surprises included Austin breaking into the top 30 list at number 10, and Norfolk, Va., and Tampa, Fla., coming in at 38th and 45th, respectively.
The study relies on the same data used by the Federal Highway Administration to pinpoint the major chokepoints, and is a follow-up to a report the Highway Users issued over 10 years ago. Bottlenecks were ranked based on backups in both directions over the entire day, not just one direction during rush hours.
The Los Angeles region had far more top bottlenecks than any other metropolitan area, claiming the 2nd through 7th worst spots, as well as the 11th, 13th, 14th, 29th, 30th and 40th. LA's worst was the 405 between SR22 and the 605, where the annual cost of delay exceeded $190 million, wasting 1.8 million gallons and 36.7 million pounds of CO2, with daily backups over 4 miles long.
Also breaking into the top 10 was New York City with the 8th and 9th worst bottleneck at the notorious Lincoln Tunnel and on I-95 from Manhattan across the Bronx. Metropolitan New York also had the 18th, 19th, 21st, 31st, 33rd, 37th, and 42nd ranked chokepoints.
The report notes that bottlenecks can be fixed and points to specific chokepoints that have been addressed and, as a result, were not included in the rankings. Projects cited include the Woodrow Wilson Bridge replacement on I-495 in the Washington, DC area, the Marquette Interchange in Milwaukee, and the Katy Freeway reconstruction in Houston.
Data for this report was gathered and analyzed by CPCS Transcom Inc., a management consulting firm specializing in transportation sector strategic, economic analysis, and policy advice. Data for the study come from the American Transportation Research Institute and HERE North America LLC GPS probes. The HERE/ATRI data set is similar to the Federal Highway Administration's National Performance Management Research Data Set. The data set allows for a rigorous estimate of delays due to congestion. The HERE /ATRI data set comes from passenger and commercial vehicles to provide actual traffic and speed measurements.
Further information about this study is available on the Highway Users website at www.highways.org.
More Operations

How Fleets Can Recruit and Train Veterans for Technician Roles
Here's how the technician shortage has affected uptime for fleets, and what to do about it.
Read More →
Avis Budget Group Deploys Neology Toll Management Technology Across Major Brands
Neology’s neoFleet platform will manage toll transactions and toll-authority operations for vehicles across Avis, Budget, Payless, Budget Truck and Zipcar.
Read More →
Fleet Personal-Use Charges Edge Higher in 2026
Nearly eight in 10 surveyed fleets allow personal use of company vehicles, while just over half of respondents report charging employees for the privilege.
Read More →
The Future of Fleet + What’s Changing Right Now | AF News Recap
Could developments overseas offer a preview of what’s coming for U.S. fleets? This week, we’re looking at the future of AI, autonomy, and electrification, plus Ford Pro’s new certified pre-owned program, smarter vehicle offboarding, and a new way for fleets to manage toll expenses.
Read More →
How to Handle Vehicle Offboarding
What do fleet managers need to do when a driver leaves?
Read More →
Sponsored•October 1, 2026
Fleet Manager’s Ultimate Playbook: Navigating the New Standard in OEM Connectivity
Rising operating costs, driver safety concerns, and unplanned downtime are putting unprecedented pressure on modern fleets. Discover how fleet managers use embedded OEM connectivity and real-time vehicle data to cut TCO, prevent downtime, and protect drivers without aftermarket telematics hardware.
Read More →
U.S. Bank Adds Verra Mobility Toll Management to Voyager Fleet Platform
The integration allows U.S. Bank Voyager fleet customers to manage toll payments and violations alongside fuel, EV charging and maintenance expenses.
Read More →
ADAS Prevents Crashes. But Repairs Cost More | AF News Recap
ADAS-equipped vehicles may crash less often, but they can cost more when they do. This week, we’re breaking down what that tradeoff means for fleets, plus Subaru’s first Forester Wilderness Hybrid, Nissan’s new e-POWER Rogue, and why Calstart has become Catalyst Mobility.
Read More →
Moventum Fleet Management Names Mark Iorillo Head of Sales
Iorillo brings nearly 20 years of fleet management and sales experience to the role, including previous positions at Element Fleet Management, CEI, Donlen and Ryder.
Read More →
Fleet Has a Talent Pipeline Problem. What Comes Next? | AF News Recap
Where will fleet’s next generation of leaders come from? This week, we’re looking at the industry’s talent pipeline, what certification can add to a fleet career, how to build an award-worthy track record, and the return of Automotive Fleet’s Personal Use Survey.
Read More →