

GreenRoad Report Details Most Common Risky or Inefficient Maneuvers Fleet Drivers Make
GreenRoad 's 2012 Fleet Driver Performance Data Benchmark Report, analyzed safety performance data for more than 70,000 drivers worldwide.

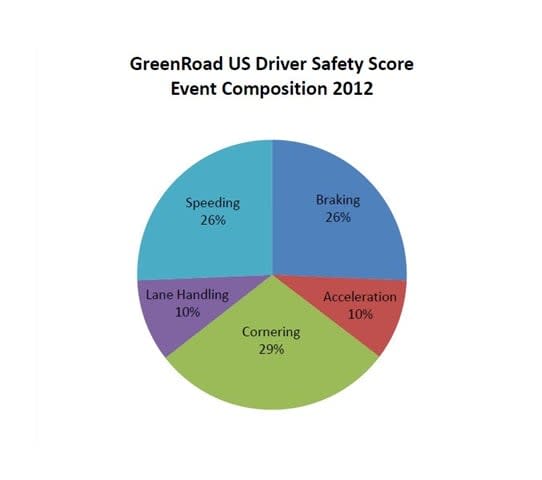
GreenRoad's 2012 Fleet Driver Performance Data Benchmark Report showed the breakdown of risky or inefficient driving manuevers across 70,000 drivers worldwide. Image courtesy GreenRoad.
GreenRoad's 2012 Fleet Driver Performance Data Benchmark Report showed the breakdown of risky or inefficient driving manuevers across 70,000 drivers worldwide. Image courtesy GreenRoad.
A new report from driver performance management services company GreenRoad provided new data about fleet drivers’ safety records and driving habits. The company’s 2012 Fleet Driver Performance Data Benchmark Report, analyzed safety performance data for more than 70,000 drivers worldwide.
To start, the report said the risky or inefficient driving events drivers most commonly make include corner handling (29%), harsh braking (26%), and speeding (26%). This is a change from 2011, where drivers' most common risky maneuver was speeding, at 40% of the total. GreenRoad attributes this change to use of its smartphone app, which provides immediate feedback.
“We believe the use of our smartphone apps have helped drivers become more aware of their risky speeding behavior and we are seeing those drivers modify their behavior, thus resulting in an evening out of the Safety Score mix for 2012,” said Karen White, senior vice president of customer solutions for GreenRoad.
Next, the report found that although there aren’t any seasonal variations in driver performance, there are variations depending on the time of day. Safety scores show small numbers (and safer driving) during the early morning, with scores as low as 2 (anything under 20 is considered “safe” driving), and as high as 9 during peak, rush-hour periods.
GreenRoad’s report also showed that drivers using GreenRoad’s service (the 70,000 drivers the company has data for) showed Safety Score improvements going from 29 to 21 in 2012, which is a 28% improvement. Also, GreenRoad said the drivers it’s monitoring improved their Safety Scores by nearly 50% within six months.
GreenRoad calculates its Safety Score based on driver performance in five categories, including braking, acceleration, corner handling, lane handling, and speeding.
You can view the full report here (requires registration).
More Safety

Top 50 Executive Fleets
It is that time of year again! Time for the 2026 list of the Top 50 Executive Fleets, presented by Automotive Fleet and Volvo as part of its annual Fleet 500. Download now to see this year's list of companies!
Read More →
How Better Visibility Cut Speeding Violations by 48%
Fleet leaders don't need more data, they need clearer visibility into what the data is saying. This case study explores how one utility replaced speeding-event counts with a single metric — miles driven in violation — to strengthen safety and significantly reduce speeding violations.
Read More →
Operation Safe Driver Week: Why the Industry's Oldest Safety Campaign Still Matters to Fleets
A look at how a 2007 enforcement initiative became one of the most consequential weeks on the fleet safety calendar, and what it means for your drivers in 2026.
Read More →
Nexar-Nauto Merger Aims to Give Fleets Better Safety Intelligence Through Larger Driving Dataset
Stefan Heck tells Automotive Fleet that combining more than 10 billion miles of driving history with Nexar's AI models will give fleets deeper insights into driver risk and roadway conditions than either company could provide independently.
Read More →
From Silos to Solutions: Relationship Management for Safer Fleets
From telematics adoption and driver accountability to policy consistency and risk mitigation, this episode breaks down what it really takes to build a safer fleet culture without slowing business down.
Read More →
IIHS Launches First Commercial Vehicle Safety Evaluations
The Insurance Institute for Highway Safety has begun evaluating heavy-duty pickups and cargo vans for driver protection. Which models earned top marks?
Read More →
Reducing Risk by Eliminating Phone Use Behind the Wheel
Hosted with the cofounder of Lifesaver Mobile, this episode addresses phone use behind the wheel and how to design a driving environment that actually helps prevents accidents.
Read More →
Cameras, Safety and Insurance: From Reactive Claims to Real-Time Prevention (Part 2 of 2)
Part Two: Commercial auto remains one of the most challenging and costly lines of coverage for fleet operators and insurers alike. Continue learning more about how to effectively address these issues from Onur Aksan, Enterprise Business Development Executive, Geotab
Read More →
How 5-Second Telematics Data Is Changing Fleet Safety
This episode connects with Steve Santostasi of Ford Pro and covers how a few seconds of data can make a difference in fleet safety.
Read More →
The Two Biggest Summer Downtime Threats for Fleets
A conversation with a maintenance expert reveals the two most common summer maintenance pains and how to prevent them.
Read More →