

Fleet Driver Report Says North American Drivers Safer Than U.K. Drivers
REDWOOD CITY, CA -- The study, based on the behavior of 85,000 fleet drivers across North America and the U.K., shows the GreenRoad worldwide average safety score improved by 24% in 2011. In North America, speeding was the most common risky behavior.
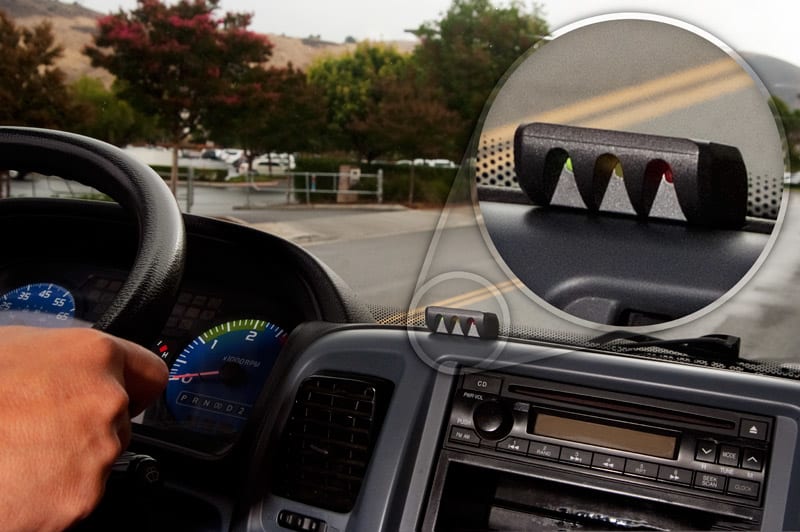
The GreenRoad data is based on the safety scores automatically calculated through the use of sophisticated in-vehicle technology that captures and tabulates risky or fuel-inefficient driving events.
REDWOOD CITY, CA – GreenRoad, a leader in driver performance and safety management, has released its first annual GreenRoad Worldwide Fleet Driver Performance Benchmark Report. The report aggregates 2011 data representing actual driving behavior of 85,000 fleet drivers logging over 127 million trips and 7.4 billion miles across North America and the United Kingdom.
Overall, in 2011 the GreenRoad worldwide average safety score improved by 24%, and North American fleet drivers tended to be safer than their U.K. counterparts. In North America, speeding was the most dominant unsafe driving behavior. But in the U.K., harsh braking was the most common risky behavior.
The report also shows that in the U.K., December was the safest fleet driving month and January was the riskiest. In North America, average safety scores didn’t vary widely from month to month.
The GreenRoad data is based on the safety scores automatically calculated through the use of sophisticated in-vehicle technology that captures and tabulates risky or fuel-inefficient driving events. The lower the safety score, the safer the driver. Driving was measured across five major categories: braking, acceleration, corner handling, lane handling and speeding.
"Through this data we begin to more clearly understand the factors impacting fleet safety," said Jim Heeger, chief executive of GreenRoad. "This is critical to reach the goal that we all share: delivering the best drivers on the road -- safe, fuel-efficient and green. We have a rich store of behavior-based data for reducing insurance and crash costs which will only get bigger and more valuable over time."
In 2011, the GreenRoad worldwide average safety score dropped to 22 versus 29 -- a 24% drop. The safety score averages were calculated across those drivers who had more than 500 driving hours with GreenRoad in 2011.
The 2011 GreenRoad benchmark data shows important geographic differences between North American and U.K. safety scores. In North America, speeding was the most dominant safety event, making up 40% of the average safety score’s risky maneuvers. Sharp cornering was next at 26%, with harsh braking following at 16%, lane handling 10% and rapid acceleration at 8%.
In the U.K., harsh braking was the most common risky behavior at 43%, followed by sharp cornering at 39%, land handling and acceleration at 8% each, and speeding at 2% of the safety score composition.
"U.K. fleet routes are largely urban environments with extensive roundabouts and other road features that require precise cornering ability," Heeger explained. "On the other hand, North American fleets tend to drive in a more mixed environment of urban, suburban and rural environments with more freeway and highway driving. Thus, you see the tendency for fleet drivers to speed in the U.S."
According to the data, 11 p.m. to 1 a.m. was the riskiest driving time in North America. In the U.K., 11 p.m. to midnight was the riskiest.
The first annual GreenRoad Worldwide Fleet Driver Performance Benchmark Report is based on analysis of GreenRoad proprietary data. The GreenRoad Safety Score for 2011 versus 2010 compares those drivers who logged more than 500 driving hours with GreenRoad. The driver safety score analysis demonstrates how GreenRoad impacts driver Safety Scores over time. The sample included 1,000 drivers who have accumulated the most driving hours on the GreenRoad service from companies with fleets that represent the general market.

The GreenRoad data is based on the safety scores automatically calculated through the use of sophisticated in-vehicle technology that captures and tabulates risky or fuel-inefficient driving events.
For the full report, click here.
For more information about GreenRoad and its services, click here.
More Safety

How Better Visibility Cut Speeding Violations by 48%
Fleet leaders don't need more data, they need clearer visibility into what the data is saying. This case study explores how one utility replaced speeding-event counts with a single metric — miles driven in violation — to strengthen safety and significantly reduce speeding violations.
Read More →
Operation Safe Driver Week: Why the Industry's Oldest Safety Campaign Still Matters to Fleets
A look at how a 2007 enforcement initiative became one of the most consequential weeks on the fleet safety calendar, and what it means for your drivers in 2026.
Read More →
Nexar-Nauto Merger Aims to Give Fleets Better Safety Intelligence Through Larger Driving Dataset
Stefan Heck tells Automotive Fleet that combining more than 10 billion miles of driving history with Nexar's AI models will give fleets deeper insights into driver risk and roadway conditions than either company could provide independently.
Read More →

From Silos to Solutions: Relationship Management for Safer Fleets
From telematics adoption and driver accountability to policy consistency and risk mitigation, this episode breaks down what it really takes to build a safer fleet culture without slowing business down.
Read More →
IIHS Launches First Commercial Vehicle Safety Evaluations
The Insurance Institute for Highway Safety has begun evaluating heavy-duty pickups and cargo vans for driver protection. Which models earned top marks?
Read More →
Reducing Risk by Eliminating Phone Use Behind the Wheel
Hosted with the cofounder of Lifesaver Mobile, this episode addresses phone use behind the wheel and how to design a driving environment that actually helps prevents accidents.
Read More →
Cameras, Safety and Insurance: From Reactive Claims to Real-Time Prevention (Part 2 of 2)
Part Two: Commercial auto remains one of the most challenging and costly lines of coverage for fleet operators and insurers alike. Continue learning more about how to effectively address these issues from Onur Aksan, Enterprise Business Development Executive, Geotab
Read More →
How 5-Second Telematics Data Is Changing Fleet Safety
This episode connects with Steve Santostasi of Ford Pro and covers how a few seconds of data can make a difference in fleet safety.
Read More →
Managing Road Risk at Scale: Why Fleet Safety Needs a Data-Driven Framework
Insights from the FIA Road and Driver Safety Indexes reveal how to manage road risk on a larger scale.
Read More →
Stellantis Recalls 1.3 Million Jeep Vehicles Worldwide Over Fire Risk
Stellantis is recalling more than 1.3 million Jeep Wrangler and Gladiator models worldwide over a fire risk linked to power steering pump wiring.
Read More →