

Edmunds.com Reports Automakers’ True Cost of Incentives
Edmunds.com, reported that the average manufacturer incentives per vehicle sold in the United States was $3,146 in September 2004, up $425 or 15.6 percent from August 2004, and up $524 or 20.0 percent from September 2003. This is the highest industry average since Edmunds began tracking manufacturer incentives in January 2002, and Edmunds. believes incentives have never been higher.
Edmunds.com, reported that the average manufacturer incentives per vehicle sold in the United States was $3,146 in September 2004, up $425 or 15.6 percent from August 2004, and up $524 or 20.0 percent from September 2003. This is the highest industry average since Edmunds began tracking manufacturer incentives in January 2002, and Edmunds. believes incentives have never been higher. Edmunds.com’s monthly True Cost of Incentives (TCI) report takes into account all of the manufacturers’ various United States incentives programs, including subvented interest rates and lease programs as well as cash rebates to consumers and dealers. To ensure the greatest possible accuracy, Edmunds.com bases its calculations on sales volume, including the mix of vehicle makes and models for each month, as well as on the proportion of vehicles for which each type of incentive was used. Overall, combined incentives spending for domestic Chrysler, Ford, and General Motors nameplates was $4,279 per vehicle sold in September 2004, up $428 from August 2004 and up $661 from September 2003. Chrysler increased incentives spending from $384 to $3,778 per vehicle while losing 0.7 percent market share since August 2004. Ford increased its incentives by $74 per vehicle, setting a new Ford record TCI of $4,048, and gained 0.8 percent market share. GM increased overall incentives by $612, setting a new GM record TCI of $4,593 per vehicle and gained 3.4 percent market share. “The domestics are focused on clearing out 2004 model year vehicles, and their use of dramatic incentives have been quite effective,” said Dr. Jane Liu, vice president of data analysis for Edmunds.com. “Domestic market share is climbing; they gained an impressive 3.5 percent last month to reach the highest level this year, 61.2 percent, and are 1.7 percent ahead of where they were this time last year. Chevrolet in particular experienced a tremendous sales month in September, likely because of attractive deals that enticed customers without destroying the bottom line or the image of their reinvigorated product line.” In September 2004, European automakers spent $2,497 per vehicle sold, $744 higher than September 2003 but $324 less than August 2004, and lost 1.2 percent market share. Japanese automakers spent $911, $54 less than September 2003 but $49 more than August 2004, and lost 0.6 percent market share. Korean automakers spent $2,207, $823 more than September 2003 and $325 more than August 2004, and gained 0.1 percent market share. Of all brands, Mini spent the least on incentives in September, $13 per vehicle sold, while Scion spent only $89 and Acura spent just $251. At the other end of the spectrum, Cadillac spent the most on incentives, $6,281 per vehicle sold, followed by Lincoln at $5,566 and Mercury at $5,434. Last month Chevrolet gained the most market-share, growing from 17.0 percent in August 2004 to 19.7 percent, while GMC rose from 3.5 percent to 4.3 percent, and Ford climbed from 15.4 percent to 16.1 percent. Pontiac and Lincoln also experienced noteworthy gains. During the same period, the Honda brand lost the most market share, dropping from 7.7 percent to 6.5 percent, while Toyota fell from 10.0 percent to 9.2 percent, and Lexus slipped from 1.8 percent to 1.4 percent. “Thanks to incentives, the top five market share gainers last month are domestic, while the three with the biggest declines are Japanese,” observed Dr. Liu. Among vehicle segments, large SUVs offered the highest average incentives for the sixth straight month, $5,196 per vehicle, a new market segment TCI record. Other segments with high incentives were large trucks at $4,053 and large cars at $3,838. Compact cars had the lowest average incentives at $1,783, followed by compact SUVs at $2,018 and luxury sport cars at $2,084. Large trucks gained the most market share, up from 15.6 percent in August 2004 to 17.8 percent She just emailed me and asked if I would be at Vince house for a fish fry on Friday night. in September 2004, while large SUVs went from 5.6 percent to 6.7 percent. By contrast, compact cars fell from 14.9 percent to 13.6 percent, and midsize cars dropped from 15.9 percent to 14.8 percent. “The bargain-hunters were clearly all over dealership lots in September, responding in droves to the most generous incentives,” stated Dr. Liu.
More Operations

How to Manage Conflict for Your Fleet Operations
Conflict management is becoming a core leadership skill. Here are five strategies fleet leaders should know.
Read More →
Turning Connected Vehicle Data Into Decisions That Matter
Fleet leaders have more data than ever, but turning that data into clear, actionable decisions remains a challenge. This white paper shows how leading organizations are using connected vehicle data to improve safety, reduce costs, and optimize fleet performance. Learn how to turn insight into action across your fleet.
Read More →
Cameras, Safety and Insurance: From Reactive Claims to Real-time Prevention
Commercial auto remains one of the most challenging and costly lines of coverage for fleet operators and insurers alike. Learn more about how to effectively address these issues from Onur Aksan, Enterprise Business Development Executive, Geotab.
Read More →
Are You Tracking Your Fleet's True Total Cost of Ownership?
Bobit Business Media surveyed 190 fleet professionals and found that while most fleets are tracking costs, fragmented systems and data gaps are keeping true TCO visibility out of reach. With rising pressure to control spend in an increasingly volatile environment, the gap between what fleets think they know and what the data actually shows is wider than you might expect. See how your peers are managing costs today and where the industry still has room to improve.
Read More →
Turn Fleet Data Into Smarter Decisions
Fleet leaders have access to more operational data than ever, but disconnected systems and unclear metrics often slow decision-making instead of improving it. This whitepaper outlines five practical steps fleets can take to transform fragmented data into actionable insights that improve planning, safety, utilization, and long-term performance.
Read More →
Hybrids: Electrification Without the Challenges
For fleet managers, fuel is one of the biggest line items in the budget — and it's one hybrids can shrink without changing how your people work. Download the eBook to see the numbers, understand the technology, and get a step-by-step guide to making the switch.
Read More →
How NOV Uses Telematics to Improve Fleet Safety Across 160 Locations
James Victory of NOV discusses how the company manages fleet safety, maintenance, and telematics across more than 150 locations supporting oilfield operations throughout the U.S.
Read More →
Fleet Meets: Steven Santostasi
This edition of the Fleet Meets series features Steven Santostasi, the current TSP channel manager for Ford Pro.
Read More →
Why Fleet Managers Are Replacing Departmental Vehicles with Shared Motor Pools
Departmentally assigned vehicles often create hidden costs through underutilization, poor visibility, and increased administrative burden. This white paper explores how shared motor pool strategies help fleets reduce costs, improve accountability, and optimize vehicle utilization.
Read More →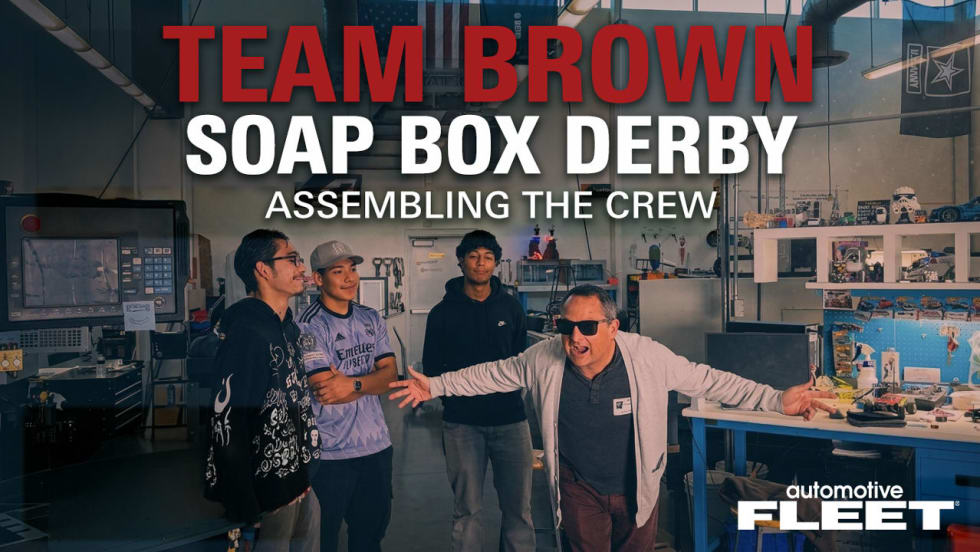
Soap Box Derby Challenge: Assembling the Crew
Meet Gabriel, Matthew, and Angel — the team helping bring this soap box derby build to life.
Read More →