

Brownsville, Texas, Named Safest-Driving City
Other cities making Allstate’s annual safest-driving list include Kansas City, Madison, Cape Coral and Boise.
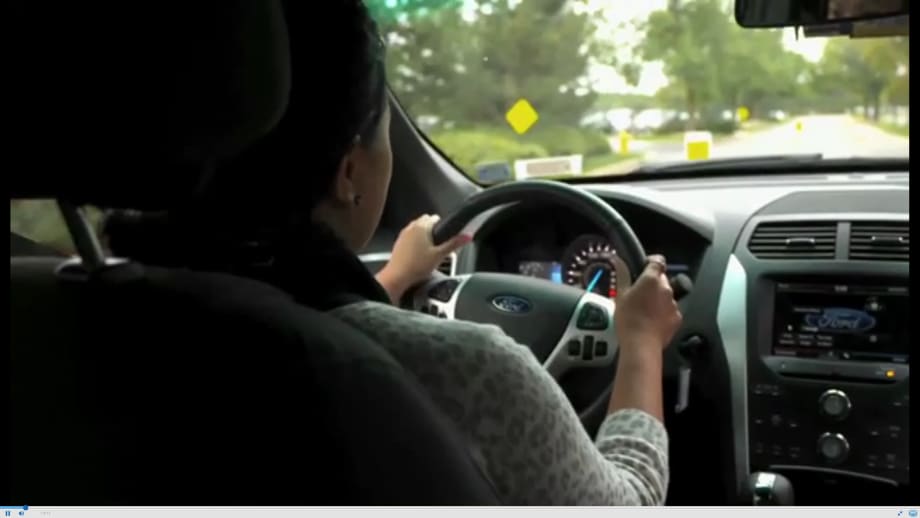
Screen shot courtesy of Allstate.
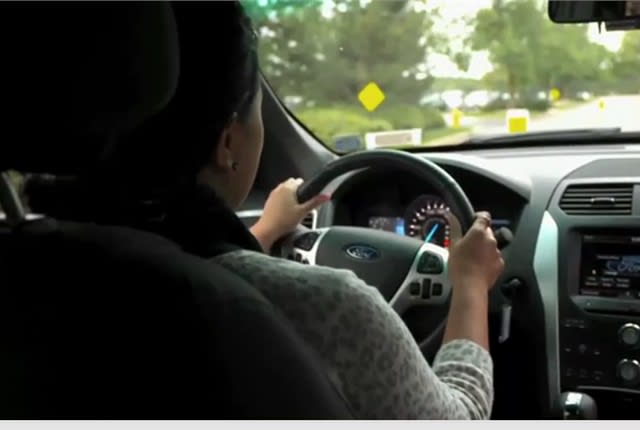
Screen shot courtesy of Allstate.
Allstate’s annual America’s Best Drivers Report has identified Brownsville, Texas, as the safest-driving city in the country.
Based on Allstate Insurance Co. claims data, the 12th annual report measures vehicle collision frequency in America’s 200 largest cities to determine which ones have the safest drivers. The average driver in Brownsville, Texas, experiences an auto collision every 14.6 years, which is 31.4% less often than the national average of every 10 years.
Also cracking the Top 10 list of safest-driving cities are Kansas City, Kan.; Madison, Wis.; Cape Coral, Fla.; Boise, Idaho; Huntsville, Ala.; Port Saint Lucie, Fla.; Wichita, Kan.; Olathe, Kan.; and Reno, Nev.
The bottom 10, or least safest-driving cities, are Boston; Worcester, Mass.; Baltimore; Washington, D.C.; Springfield, Mass.; Glendale, Calif.; Providence, R.I.; Los Angeles; Philadelphia; and San Francisco.
“With millions of drivers expected to hit the roads nationwide during the July 4th weekend, our report demonstrates the importance of always putting safety first,” said Glenn Shapiro, executive vice president of claims for Allstate.
National safety experts say drivers are now spending more time on the road and suffering more fatal collisions than in recent years. The U.S. Department of Transportation reports that from March 2015 to February 2016, Americans drove 3.15 trillion miles — an increase of more than 3% over the previous 12 months and the largest year-to-year increase in more than two decades.
According to the National Safety Council, more than 38,000 roadway fatalities occurred last year — the highest count since 2008. Preventable human factors — such as drunk, distracted or drowsy driving; speeding; and failure to use safety features — contribute to 94% of car crashes.
According to the Insurance Institute for Highway Safety, intoxication is a significant factor in Fourth of July crash fatalities, with 42% between 2010 and 2014 involving at least one driver with a blood-alcohol concentration over the legal driving limit of .08.
“While July Fourth is consistently the deadliest day on the road, the toll of crash deaths goes on every day, all year long,” said Adrian Lund, president of IIHS. “If everyone buckles up, avoids distractions, obeys the speed limit and doesn’t drink and drive, we can make July Fourth and every day on the road a lot safer.”
The following are the top 10 safest driving cities, according to Allstate’s 2016 America’s Best Drivers Report:
City & Overall Ranking | Collision Likelihood Compared to National Average | Average Years Between Collisions |
1. Brownsville, Texas | 31.4% less likely | 14.6 |
2. Kansas City, Kan. | 26.3% less likely | 13.6 |
3. Madison, Wis. | 24.7% less likely | 13.3 |
4. Cape Coral, Fla. | 22.3% less likely | 12.9 |
5. Boise, Idaho | 22.1% less likely | 12.8 |
6. Huntsville, Ala. | 21.4% less likely | 12.7 |
7. Port Saint Lucie, Fla. | 20.1% less likely | 12.5 |
8. Wichita, Kan. | 19.7% less likely | 12.5 |
9. Olathe, Kan. | 19.6% less likely | 12.4 |
10. Reno, Nev. | 18.3% less likely | 12.2 |
Click here for an interactive map showing this year’s findings and for historical collision-frequency rankings from the past 11 years.
The report defines a collision as any auto crash resulting in a property damage claim. Allstate’s auto policies represent nearly 10% of all U.S. auto policies, making this report a realistic snapshot of what’s happening on America’s roadways, the company said.
For the second straight year, the report also provides insight into braking habits in more than 100 cities across the country, using hard-braking data culled from Allstate’s Drivewise offering.
A hard-braking event is defined as slowing down eight miles per hour or more over a one-second period. Allstate found a correlation between hard braking and collision frequency. Cities with higher collision frequency also recorded more hard-braking events.
Nationally, on average, a driver will experience 19 hard-braking events for every 1,000 miles driven. The following are the cities with drivers who experience the fewest hard-braking events per 1,000 miles driven:
Drivewise Hard-Braking Events
(Cities’ drivers with the fewest events per 1,000 miles)
Madison, Wis.
9.0
Anchorage, Alaska
9.3
Honolulu, Hawaii
10.1
Des Moines, Iowa
10.5
Wichita, Kan.
11.1
Boise, Idaho
11.6
Lincoln, Neb.
11.7
Kansas City, Kan.
12.0
Chesapeake, Va.
12.2
Jackson, Miss.
12.2
Driving tips for cities with high braking activity:
Leave room between you and other vehicles. Hard-braking collisions can occur when drivers are following other cars too closely, causing a rear-end collision. Try to avoid rear-end collisions by leaving more space and time to react to other vehicles’ actions.
Minimize distractions while driving. Distracted driving is one of the main causes of collisions. Common driving distractions include eating, grooming, talking on a cell phone or texting, interacting with other passengers, adjusting navigation devices, and playing loud music.
To download the full report, click here.
More Safety
Ram Recalls More Than 1.27 Million 1500 Pickups for Seat Belt Anchor Issue
The recall affects certain 2019-2026 Ram 1500 pickups that may have improperly attached second-row seat belt buckle anchors.
Read More →
Top 50 Executive Fleets
It is that time of year again! Time for the 2026 list of the Top 50 Executive Fleets, presented by Automotive Fleet and Volvo as part of its annual Fleet 500. Download now to see this year's list of companies!
Read More →
How Better Visibility Cut Speeding Violations by 48%
Fleet leaders don't need more data, they need clearer visibility into what the data is saying. This case study explores how one utility replaced speeding-event counts with a single metric — miles driven in violation — to strengthen safety and significantly reduce speeding violations.
Read More →
Operation Safe Driver Week: Why the Industry's Oldest Safety Campaign Still Matters to Fleets
A look at how a 2007 enforcement initiative became one of the most consequential weeks on the fleet safety calendar, and what it means for your drivers in 2026.
Read More →
Nexar-Nauto Merger Aims to Give Fleets Better Safety Intelligence Through Larger Driving Dataset
Stefan Heck tells Automotive Fleet that combining more than 10 billion miles of driving history with Nexar's AI models will give fleets deeper insights into driver risk and roadway conditions than either company could provide independently.
Read More →
From Silos to Solutions: Relationship Management for Safer Fleets
From telematics adoption and driver accountability to policy consistency and risk mitigation, this episode breaks down what it really takes to build a safer fleet culture without slowing business down.
Read More →
IIHS Launches First Commercial Vehicle Safety Evaluations
The Insurance Institute for Highway Safety has begun evaluating heavy-duty pickups and cargo vans for driver protection. Which models earned top marks?
Read More →
Reducing Risk by Eliminating Phone Use Behind the Wheel
Hosted with the cofounder of Lifesaver Mobile, this episode addresses phone use behind the wheel and how to design a driving environment that actually helps prevents accidents.
Read More →
Cameras, Safety and Insurance: From Reactive Claims to Real-Time Prevention (Part 2 of 2)
Part Two: Commercial auto remains one of the most challenging and costly lines of coverage for fleet operators and insurers alike. Continue learning more about how to effectively address these issues from Onur Aksan, Enterprise Business Development Executive, Geotab
Read More →
How 5-Second Telematics Data Is Changing Fleet Safety
This episode connects with Steve Santostasi of Ford Pro and covers how a few seconds of data can make a difference in fleet safety.
Read More →