




Black Book Says SUVs Showed Strongest Retention During July and Cargo Minivans Saw Biggest Drop
SUVs, including the Compact, Full-size, Luxury, and Mid-size categories, made up four of the top seven best-performing vehicle segments for the month, according to a new report from Black Book.
Used-vehicle from model-years 2007 through 2011 depreciated 1.4 percent overall in July, and all four segments of SUVs, including Compact, Full-size, Luxury, and Mid-size, made up four of the top seven best-performing vehicle segments for the month, according to a new report from Black Book.
The Compact SUV segment had the strongest month for retention values, according to Black Book, with values increasing 1.3 percent during the month. Vehicles in this segment include the Jeep Wrangler and Nissan Xterra. The average segment values at the end of July were $15,795, a -4.0% change from the same time last year, when it was $16,460.
Cargo minivans, on the other hand, saw the largest monthly depreciation, falling 3.4 percent. Vehicles in this segment include the Dodge Caravan, Ford Freestar, Dodge Grand Caravan, Ford Transit Connect, and Chevrolet Uplander. Average segment values at the end of July were $9,240, which is a -12.7 percent change from the same time last year, when the value was $10,588.
Other notable categories for the month of July included the car segment, which saw the largest depreciation change at -2.6 percent in the Upper Mid-size cars segment. Vehicles in that segment include the Honda Accord, Nissan Altima, Toyota Camry, Dodge Charger, Ford Taurus, and the Kia Optima. The average value was $10,349, which is a 17.6 percent drop from the price a year ago, which was $12,556.
Following is a chart that shows the complete breakdown for the month of July, according to Black Book:
Bodystyle | 8/1/2012 | 7/1/2013 | M Chg | 8/1/2013 | 12M Chg |
|---|---|---|---|---|---|
[$] | [$] | [%] | [$] | [%] | |
All Vehicles | $20,166 | $17,696 | -1.40% | $17,455 | -13.40% |
Domestic | $14,093 | $12,083 | -1.50% | $11,901 | -15.60% |
Dom. Trk | $17,177 | $15,825 | -1.40% | $15,610 | -9.10% |
Import | $22,157 | $18,991 | -1.40% | $18,727 | -15.50% |
Imp. Trk | $22,979 | $20,214 | -1.30% | $19,952 | -13.20% |
Compact SUV | $16,460 | $15,595 | 1.30% | $15,795 | -4.00% |
Compact Pickup | $15,611 | $14,956 | 0.00% | $14,949 | -4.20% |
Full-Size Pickup | $23,143 | $22,205 | -0.80% | $22,035 | -4.80% |
Premium Sporty Car | $49,590 | $42,551 | -0.90% | $42,152 | -15.00% |
Full-Size SUV | $21,066 | $19,053 | -1.00% | $18,871 | -10.40% |
Luxury SUV | $36,772 | $32,330 | -1.10% | $31,981 | -13.00% |
Mid-Size SUV | $18,710 | $16,934 | -1.20% | $16,732 | -10.60% |
Near Luxury Car | $17,442 | $15,021 | -1.30% | $14,832 | -15.00% |
Full-Size CUV | $23,890 | $20,153 | -1.30% | $19,896 | -16.70% |
Sporty Car | $21,772 | $19,008 | -1.30% | $18,764 | -13.80% |
Luxury Level Car | $23,804 | $20,769 | -1.30% | $20,497 | -13.90% |
Prestige Luxury Car | $38,970 | $32,814 | -1.30% | $32,382 | -16.90% |
Compact Car | $10,475 | $8,765 | -1.40% | $8,644 | -17.50% |
Mid-Size Pickup | $16,351 | $15,630 | -1.40% | $15,413 | -5.70% |
Mid-Size CUV | $20,751 | $17,985 | -1.60% | $17,698 | -14.70% |
Mini Van Wagon (Pass) | $15,090 | $12,974 | -1.60% | $12,760 | -15.40% |
Full-Size Car | $14,394 | $12,331 | -1.80% | $12,106 | -15.90% |
Entry Level Car | $8,899 | $7,543 | -1.90% | $7,398 | -16.90% |
Compact CUV | $14,935 | $13,140 | -2.00% | $12,871 | -13.80% |
Full-Size Vans Wagon (Pass) | $13,731 | $12,541 | -2.10% | $12,278 | -10.60% |
Full-Size Van Cargo | $12,846 | $11,822 | -2.20% | $11,556 | -10.00% |
Entry Mid-Size Car | $11,891 | $9,690 | -2.50% | $9,449 | -20.50% |
Upper Mid-Size Car | $12,556 | $10,620 | -2.60% | $10,349 | -17.60% |
Mini Van Cargo | $10,588 | $9,560 | -3.40% | $9,240 | -12.70% |
More Remarketing

When Should a Fleet Repair Vehicle Damage Before Remarketing?
Not every dent, scratch, or mechanical issue is worth fixing before selling a fleet vehicle. Learn how to weigh repair costs, resale value, market demand, and downtime to determine when reconditioning pays off and when selling as-is makes more sense.
Read More →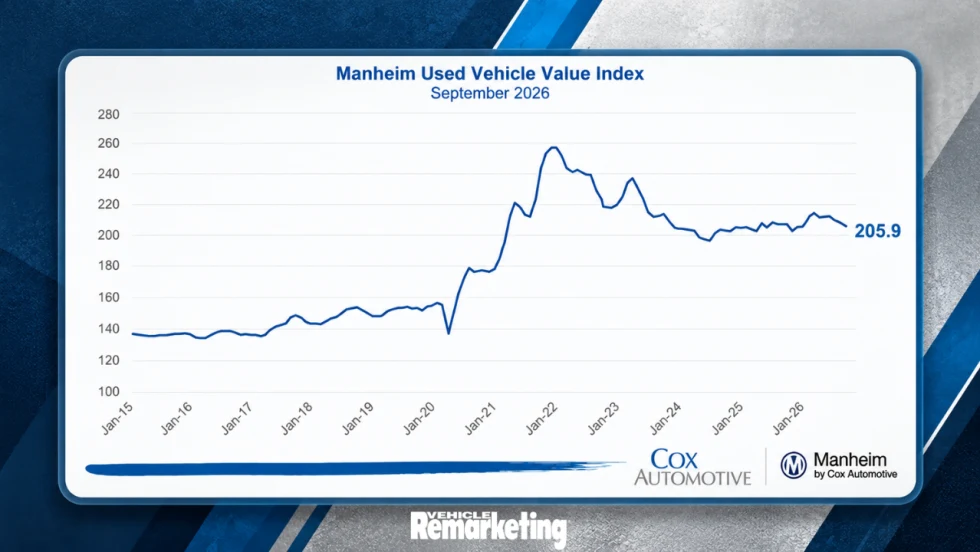
Wholesale Used-Vehicle Values Fall as Cox Automotive Cuts 2026 Forecast
Wholesale used-vehicle prices declined in September as depreciation accelerated, prompting Cox Automotive to lower its year-end forecast.
Read More →
FLD Promotes Three Executives in Leadership Changes
FLD has promoted three longtime executives, naming Gary Mott CEO, Richard Mallek president, and Ron Sanders managing partner.
Read More →
Ford Pro Launches Certified Pre-Owned Program for Commercial Vehicles
Ford Pro Advantage will offer certified pre-owned Class 1-7 commercial vehicles through more than 700 Ford Pro Commercial Vehicle Centers.
Read More →
Copart to Acquire ACV in $1.9 Billion Deal
The acquisition would expand Copart beyond its traditional salvage business into dealer-to-dealer wholesale remarketing while adding ACV’s vehicle data, inspection, and valuation technology.
Read More →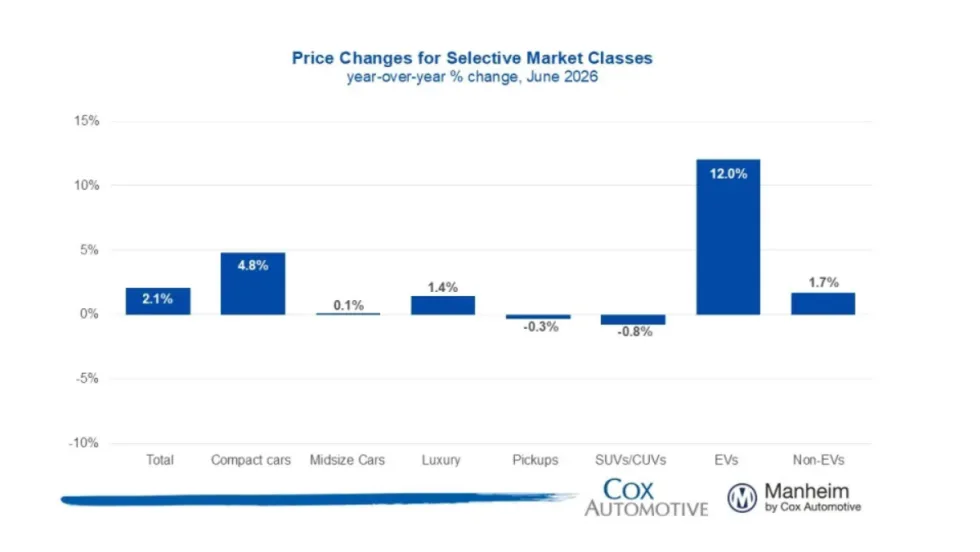
Manheim Index Shows Used-Vehicle Wholesale Prices Up 2.1% in June
The market is seeing stronger appreciation in older used vehicles this year, and the most affordable segments have been among the year’s best performers.
Read More →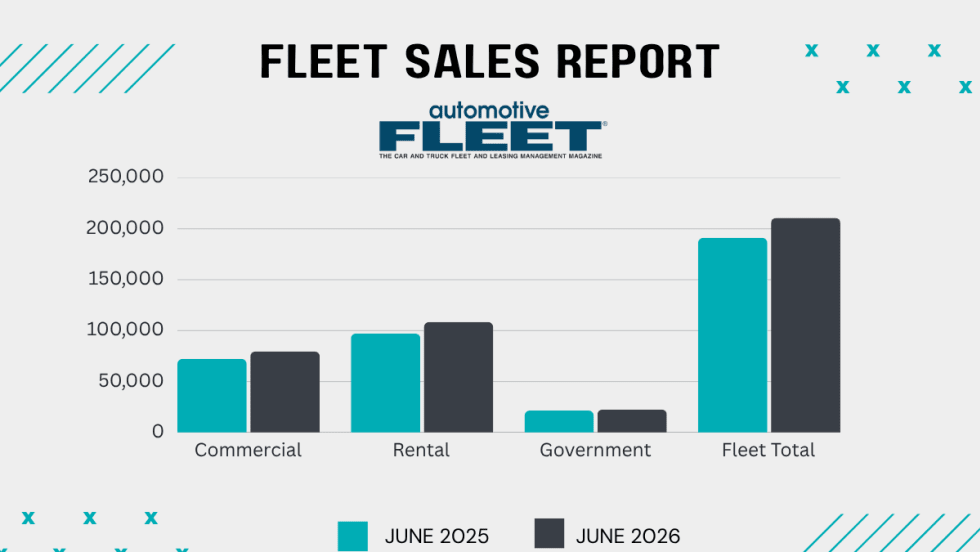
Commercial Fleet Sales Contribute To June, YTD Gains
The fleet sector has boosted its vehicle purchases at a reliable pace in the first half of this year compared with 1H 2025.
Read More →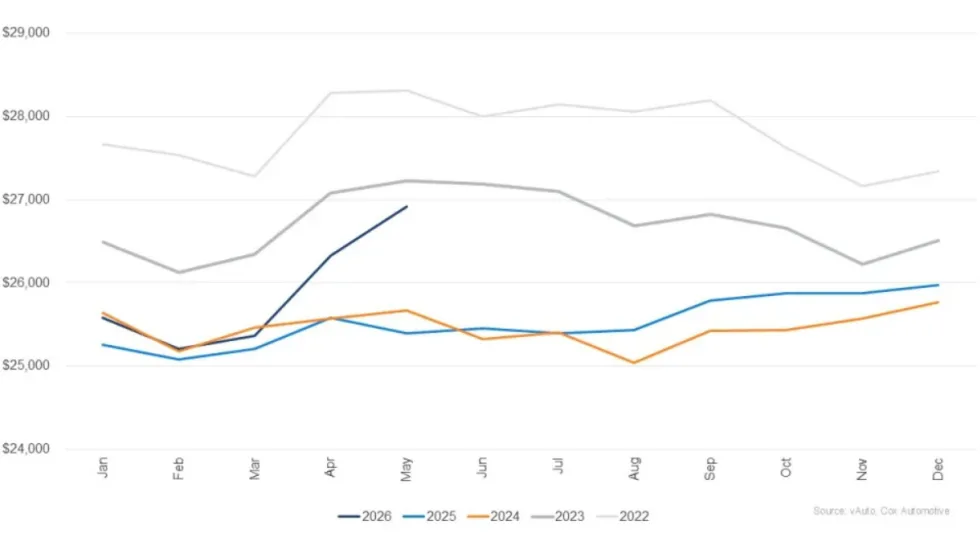
Used Vehicle Prices Climb Higher As Sales Pace Slows
The higher prices at used retail reflect strong wholesale values earlier in the spring, particularly for older, more affordable vehicles.
Read More →
Wholesale Used Vehicle Market Sustains Moderate Rise In Values, Prices
Trends continue to normalize after a strong start to the year, as consumers contend with higher gas prices in the coming summer months.
Read More →
Commercial Fleet Sales Still Lead Sectors Despite May Mini Dip
The U.S. economy's continued growth and positive business investment are creating a favorable environment for fleet vehicle demand.
Read More →