




Black Book Says Overall Used-Car Depreciation Just -0.1% During April
Black Book recently released a new analysis of vehicle depreciation rates, noting that April generally is the end of the spring buying season for used cars and that this was the case last month.
Black Book recently released a new analysis of vehicle depreciation rates, noting that April generally is the end of the spring buying season for used cars and that this was the case last month.
The company said used cars overall depreciated -0.1 percent on the month. Domestic cars increased 0.2 percent; import cars dropped -0.2 percent; domestic trucks were up 0.1 percent; and import trucks were down -0.2 percent, according to the company.
Black Book noted that vehicles in its Entry-Level Cars category saw the biggest gains, up 1.5 percent in value. Vehicles in the category include the Chevrolet Aveo, the Honda Fit, the Kia Rio, the Nissan Versa, and the Toyota Yaris. The average segment value at the April was $7,792.
Minivans saw the largest gain in the truck segments during April, up 2.7 percent for the month. These vehicles include the Dodge Caravan, Ford Transit Connect, and the Chevrolet Uplander. The average segment value at the end of April was $9,927.
The Full-Size Crossovers and Luxury SUV categories depreciated the most in Black Book’s truck segments, both falling 0.7 percent during April. Crossovers in this category include the GMC Acadia, the Buick Enclave, the Ford Flex, and the Chevrolet Traverse. SUVs include the Cadillac Escalade, Toyota Land Cruiser, Lincoln Navigator, and the BMW X5.
The Prestige Luxury Car category saw the most depreciation, according to Black Book, with the overall category falling 1.1 percent in value. Vehicles in this segment include the BMW 7 Series, the Audi A8, the Lexus GS430, the Mercedes-Benz S-Class, and the Jaguar XJ. The average segment value at the end of April was $32,938.
The chart below shows a breakdown of value changes of used vehicles:
Bodystyle | 5/1/2012 | 4/1/2013 | 1M Chg | 5/1/2013 | 12M Chg | 12M Chg |
|---|---|---|---|---|---|---|
All Vehicles | $20,669 | $17,979 | -0.10% | $17,956 | ($2,712) | -13.10% |
Domestic | $14,592 | $12,403 | 0.20% | $12,424 | ($2,168) | -14.90% |
Domestic Truck | $17,467 | $15,999 | 0.10% | $16,011 | ($1,455) | -8.30% |
Import | $22,595 | $19,265 | -0.20% | $19,222 | ($3,373) | -14.90% |
Import Truck | $23,811 | $20,611 | -0.20% | $20,564 | ($3,246) | -13.60% |
Compact Pickup | $16,176 | $15,144 | 0.20% | $15,174 | ($1,003) | -6.20% |
Compact SUV | $16,848 | $15,370 | 1.40% | $15,580 | ($1,268) | -7.50% |
Compact CUV | $15,572 | $13,534 | 0.40% | $13,584 | ($1,988) | -12.80% |
Entry Level Car | $9,476 | $7,676 | 1.50% | $7,792 | ($1,684) | -17.80% |
Entry Mid-Size Car | $12,235 | $10,046 | -0.20% | $10,031 | ($2,204) | -18.00% |
Sporty Car | $21,936 | $19,172 | -0.10% | $19,153 | ($2,783) | -12.70% |
Full-Size Pickup | $23,221 | $21,975 | 0.30% | $22,036 | ($1,185) | -5.10% |
Full-Size Car | $15,005 | $12,869 | 0.00% | $12,874 | ($2,131) | -14.20% |
Full-Size SUV | $21,626 | $19,577 | -0.50% | $19,470 | ($2,155) | -10.00% |
Full-Size Van Cargo | $13,253 | $12,020 | 0.30% | $12,054 | ($1,199) | -9.00% |
Full-Size Vans Wagon (Pass) | $14,169 | $12,729 | 0.30% | $12,765 | ($1,404) | -9.90% |
Full-Size CUV | $24,559 | $20,904 | -0.70% | $20,753 | ($3,806) | -15.50% |
Luxury Level Car | $24,331 | $21,159 | -0.20% | $21,109 | ($3,221) | -13.20% |
Luxury SUV | $38,107 | $33,149 | -0.70% | $32,930 | ($5,177) | -13.60% |
Mid-Size Pickup | $16,779 | $15,602 | 0.50% | $15,678 | ($1,101) | -6.60% |
Mid-Size SUV | $19,055 | $17,250 | -0.10% | $17,237 | ($1,818) | -9.50% |
Mini Van Cargo | $11,044 | $9,663 | 2.70% | $9,927 | ($1,117) | -10.10% |
Mini Van Wagon (Pass) | $15,820 | $13,389 | -0.30% | $13,351 | ($2,468) | -15.60% |
Mid-Size CUV | $21,378 | $18,250 | -0.30% | $18,197 | ($3,181) | -14.90% |
Near Luxury Car | $18,239 | $15,460 | -0.10% | $15,443 | ($2,796) | -15.30% |
Prestige Luxury Car | $39,638 | $33,313 | -1.10% | $32,938 | ($6,700) | -16.90% |
Premium Sporty Car | $50,360 | $43,240 | -0.60% | $42,996 | ($7,365) | -14.60% |
Compact Car | $11,057 | $9,015 | 1.10% | $9,110 | ($1,947) | -17.60% |
Upper Mid-Size Car | $13,269 | $11,008 | 0.40% | $11,052 | ($2,217) | -16.70% |
More Remarketing
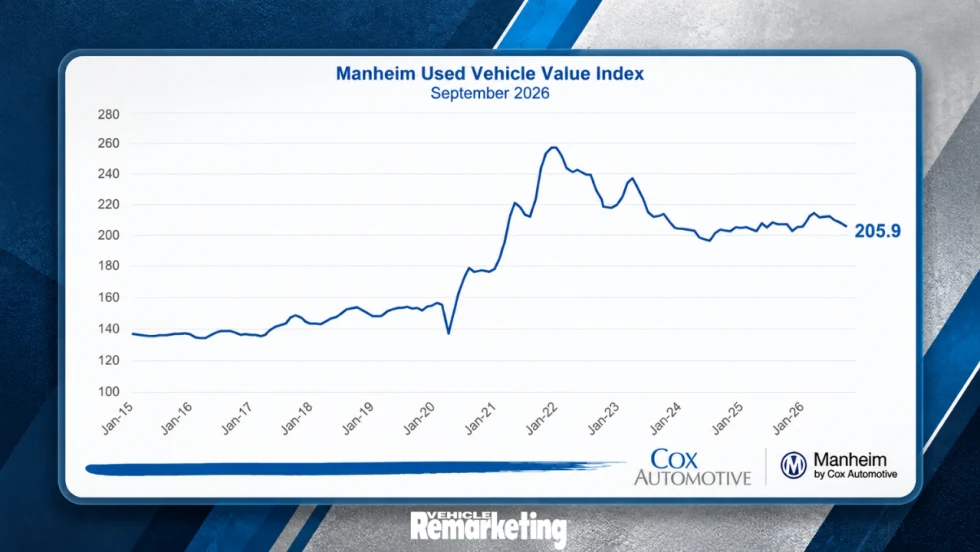
Wholesale Used-Vehicle Values Fall as Cox Automotive Cuts 2026 Forecast
Wholesale used-vehicle prices declined in September as depreciation accelerated, prompting Cox Automotive to lower its year-end forecast.
Read More →
FLD Promotes Three Executives in Leadership Changes
FLD has promoted three longtime executives, naming Gary Mott CEO, Richard Mallek president, and Ron Sanders managing partner.
Read More →
Ford Pro Launches Certified Pre-Owned Program for Commercial Vehicles
Ford Pro Advantage will offer certified pre-owned Class 1-7 commercial vehicles through more than 700 Ford Pro Commercial Vehicle Centers.
Read More →
Copart to Acquire ACV in $1.9 Billion Deal
The acquisition would expand Copart beyond its traditional salvage business into dealer-to-dealer wholesale remarketing while adding ACV’s vehicle data, inspection, and valuation technology.
Read More →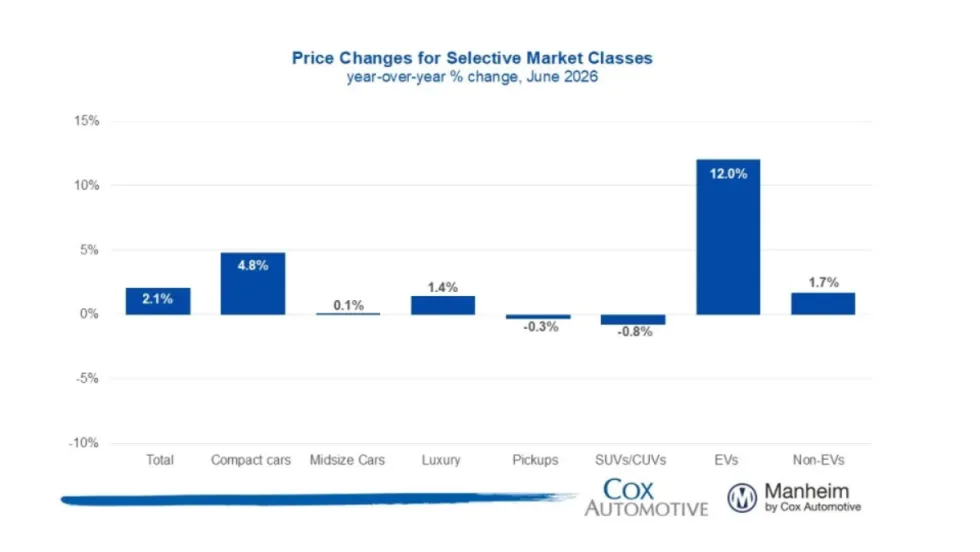
Manheim Index Shows Used-Vehicle Wholesale Prices Up 2.1% in June
The market is seeing stronger appreciation in older used vehicles this year, and the most affordable segments have been among the year’s best performers.
Read More →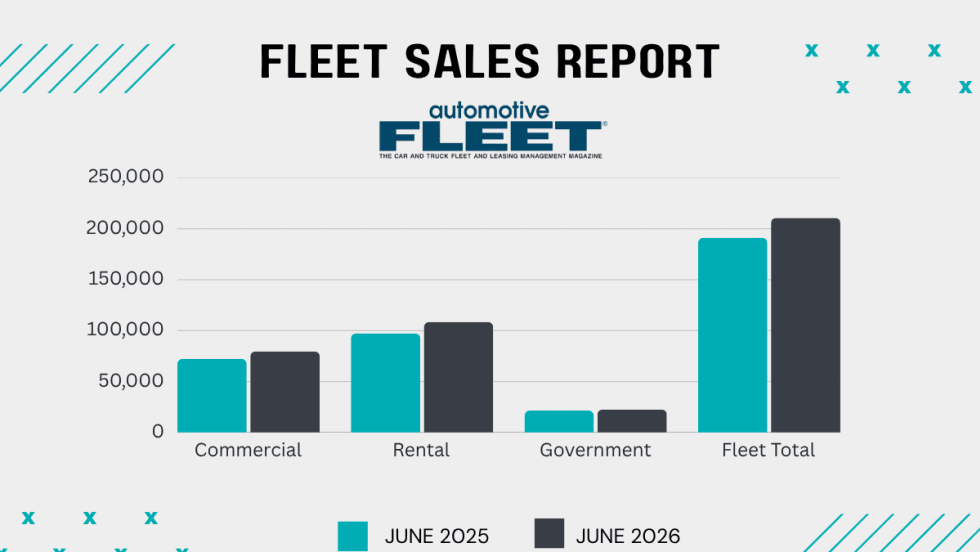
Commercial Fleet Sales Contribute To June, YTD Gains
The fleet sector has boosted its vehicle purchases at a reliable pace in the first half of this year compared with 1H 2025.
Read More →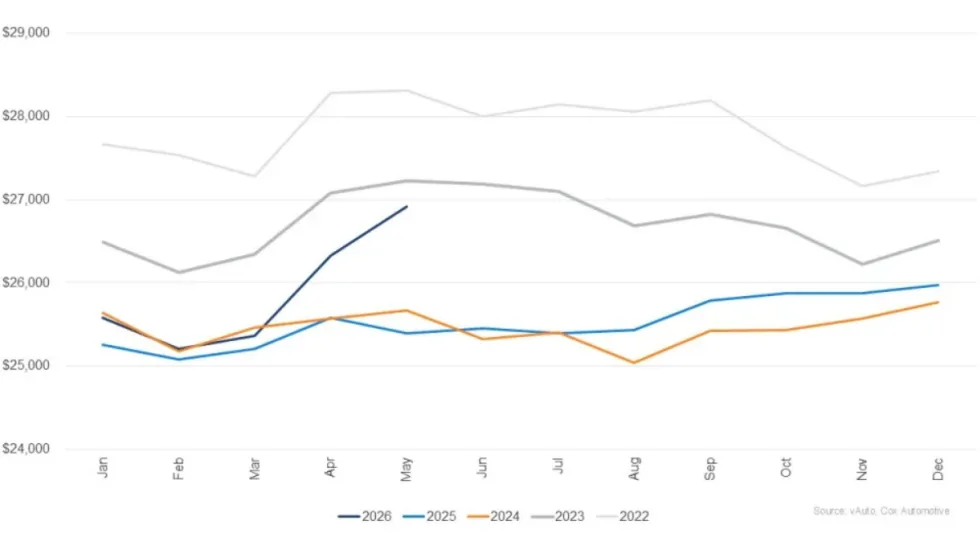
Used Vehicle Prices Climb Higher As Sales Pace Slows
The higher prices at used retail reflect strong wholesale values earlier in the spring, particularly for older, more affordable vehicles.
Read More →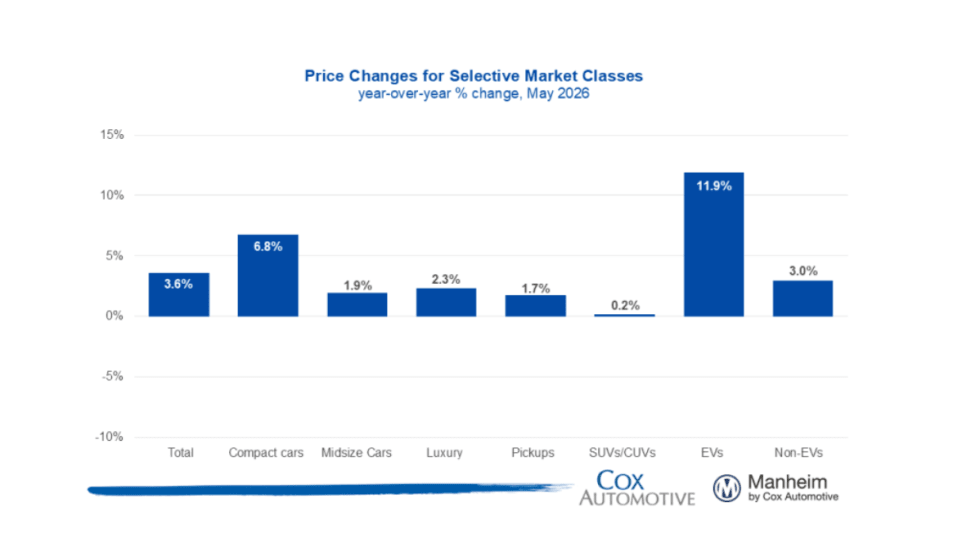
Wholesale Used Vehicle Market Sustains Moderate Rise In Values, Prices
Trends continue to normalize after a strong start to the year, as consumers contend with higher gas prices in the coming summer months.
Read More →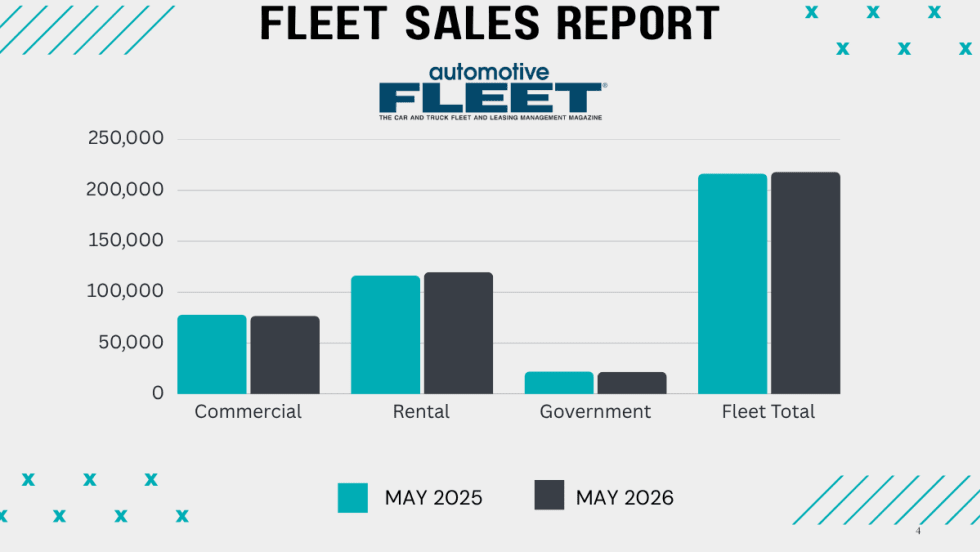
Commercial Fleet Sales Still Lead Sectors Despite May Mini Dip
The U.S. economy's continued growth and positive business investment are creating a favorable environment for fleet vehicle demand.
Read More →
How Connected Vehicle Data Is Lifting Fleet Resale Values
A vehicle health score could improve the value of fleet vehicles at remarketing. The path to a universal standard is forming, and fleets that understand the process early will be better positioned when it arrives.
Read More →