

Best Drivers Report Ranks Safety of 200 Cities
In Allstate’s 10th annual report, which identifies which cities have the safest drivers, Ft. Collins, Colo., again captures the top honor.
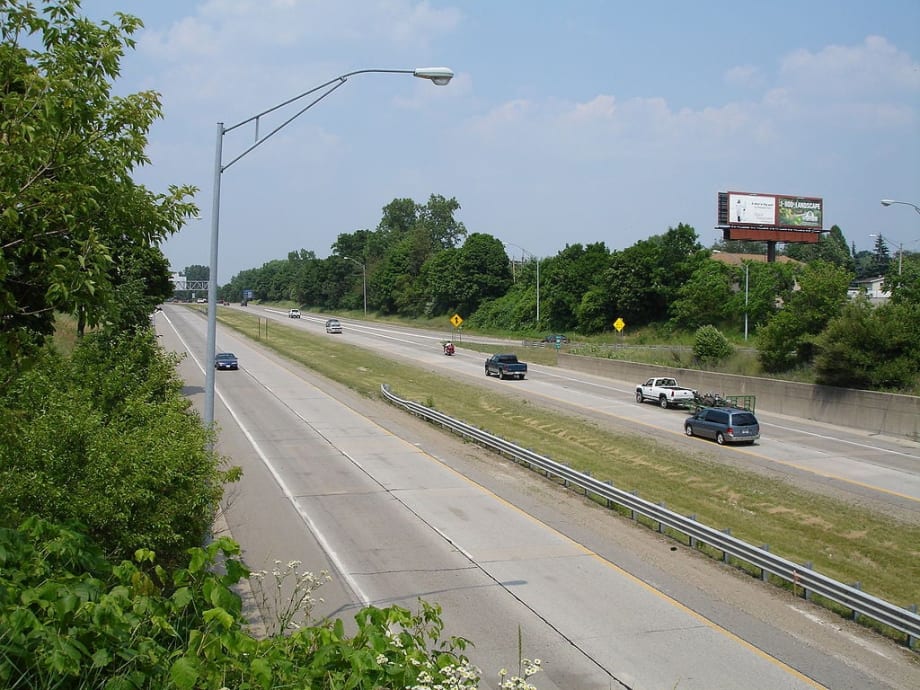
Photo by Shadowlink1014 via Wikimedia Commons.
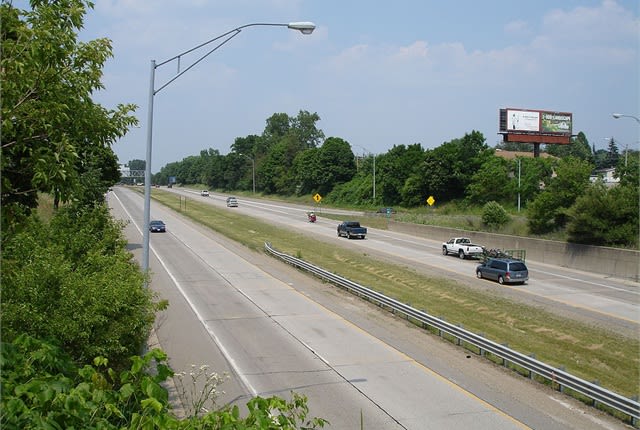
Photo by Shadowlink1014 via Wikimedia Commons.
Allstate Insurance Co. released its 10th annual “Allstate America’s Best Drivers Report,” with Ft. Collins, Colo., identified as having the safest drivers.
The report, based on Allstate claims data, ranks America’s 200 largest cities in terms of car collision frequency. This year, new data uncovers how these cities rank when factors such as population, population density and precipitation are considered.
Ft. Collins drew the top honor for the fourth year in the report’s history. The city has placed in the top 10 every year since the report’s inception. This year, the results indicate the average driver in Ft. Collins will experience an auto collision every 14.2 years, which is 29.6 percent less likely than the national average of every 10 years, Allstate said.
For the past 10 years, Allstate actuaries have conducted an in-depth analysis of company claims data to determine the likelihood drivers in America’s 200 largest cities will experience a vehicle collision compared to the national average. Reported claims of property damage were analyzed over a two-year period, from January 2011 to December 2012.
A weighted average of the two-year numbers determines the annual percentages. The report defines an auto crash as any collision resulting in a property damage claim. Allstate’s auto policies represent nearly 10 percent of all U.S. auto policies. As a result, the report offers "a realistic snapshot of what’s happening on America’s roadways," the company said.
10th Annual Allstate America's Best Drivers Report® Top 10 Safest Cities | ||
City & Overall Ranking | Collision Likelihood Compared to National Average | Average Years Between Collisions |
1. Fort Collins, Colo. | 29.6% less likely | 14.2 |
2. Brownsville, Texas | 29.5% less likely | 14.2 |
3. Boise, Idaho | 28.4% less likely | 14 |
4. Kansas City, Kas. | 22.4% less likely | 12.9 |
5. Huntsville, Ala. | 20.3% less likely | 12.6 |
6. Montgomery, Ala. | 19.4% less likely | 12.4 |
7. Visalia, Calif. | 19.1% less likely | 12.4 |
8. Laredo, Texas | 18.3% less likely | 12.2 |
9. Madison, Wis. | 17.8% less likely | 12.2 |
10. Olathe, Kas. | 17.5% less likely | 12.1 |
For the first time in the report’s 10-year history, Allstate’s interactive mapping tool demonstrates how location factors such as population, population density and precipitation weight a city’s driving safety ranking. When taking challenging roadway conditions into consideration, the ranking of some cities changed based on the likelihood for collision and these location factors.
Top 10 Rankings Based on Location Factors | |||
|---|---|---|---|
Population | Population Density | Precipitation | All Factors Combined |
1. Kansas City, Mo. | 1. Fort Collins, Colo. | 1. Brownsville, Texas | 1. Fort Collins, Colo. |
2. Fort Collins, Colo. | 2. Boise, Idaho | 2. Fort Collins, Colo. | 2. Boise, Idaho |
3. Brownsville, Texas | 3. Visalia, Calif. | 3. Kansas City, Kan. | 3. Milwaukee, Wis. |
4. Mesa, Ariz. | 4. Milwaukee, Wis. | 4. Huntsville, Ala. | 4. Madison, Wis. |
5. Boise, Idaho | 5. Madison, Wis. | 5. Boise, Idaho | 5. Visalia, Calif. |
6. Kansas City, Kan. | 6. Laredo, Texas | 6. Montgomery, Ala. | 6. Brownsville, Texas |
7. Milwaukee, Wis. | 7. Lakewood, Colo. | 7. Madison, Wis. | 7. Mesa, Ariz. |
8. Huntsville, Ala. | 8. Brownsville, Texas | 8. Olathe, Kan. | 8. Laredo, Texas |
9. Tucson, Ariz. | 9. Salinas, Calif. | 9. Kansas City, Mo. | 9. Eugene, Ore. |
10. Montgomery, Ala. | 10. Eugene, Ore. | 10. Cedar Rapids, Iowa | 10. Des Moines, Iowa |
To view the complete Allstate America’s Best Drivers Report with these new rankings, or to see previous years’ results, go to www.allstate.com/bestdriversreport.
For each of the location factors Allstate measured in this year’s report, the insurer recommends drivers use caution – especially when driving under these conditions:
Highly populated cities
Know what’s happening in the city during the time you’re driving. Find out if there are events that may impact traffic, and listen to traffic reports on your car radio. Avoid traffic jams or explore alternative routes, if possible.
Get directions to where you’re going. Review directions carefully in advance. If you get lost mid-trip, safely pull over and wait until you feel calm enough to get back on the road, using that time to get directions, check traffic or call for help.
Densely populated cities
Allow plenty of time to reach your destination. Stop-and-go traffic, gridlock, traffic signal stops, pedestrian walkways and events that create traffic detours can add time to your travel.
Stay alert. Be prepared to frequently stop or slow down for pedestrians, emergency vehicles, delivery trucks, parking cars, taxi cabs, and public transportation vehicles such as city buses.
Cities with high levels of precipitation
Be aware of road conditions. Ice, snow, fog, rain – all of these weather conditions require extra caution and slower speeds. Stopping safely in rain and snow takes greater lengths of roadway than in dry conditions.
Maintain your vehicle to prepare for extreme weather. Headlights and brake lights are critical in low visibility situations – be sure they are consistently maintained along with other critical car functions such as brakes and windshield wipers.
According to the National Highway Traffic Safety Administration, 33,500 car crash fatalities occurred in 2012. Additionally, Allstate research found that 70 percent of vehicles involved in auto claims are considered drivable, which indicates that most claims are the result of low-speed (under 35 miles per hour) collisions.
More Safety
Ram Recalls More Than 1.27 Million 1500 Pickups for Seat Belt Anchor Issue
The recall affects certain 2019-2026 Ram 1500 pickups that may have improperly attached second-row seat belt buckle anchors.
Read More →
Top 50 Executive Fleets
It is that time of year again! Time for the 2026 list of the Top 50 Executive Fleets, presented by Automotive Fleet and Volvo as part of its annual Fleet 500. Download now to see this year's list of companies!
Read More →
How Better Visibility Cut Speeding Violations by 48%
Fleet leaders don't need more data, they need clearer visibility into what the data is saying. This case study explores how one utility replaced speeding-event counts with a single metric — miles driven in violation — to strengthen safety and significantly reduce speeding violations.
Read More →
Operation Safe Driver Week: Why the Industry's Oldest Safety Campaign Still Matters to Fleets
A look at how a 2007 enforcement initiative became one of the most consequential weeks on the fleet safety calendar, and what it means for your drivers in 2026.
Read More →
Nexar-Nauto Merger Aims to Give Fleets Better Safety Intelligence Through Larger Driving Dataset
Stefan Heck tells Automotive Fleet that combining more than 10 billion miles of driving history with Nexar's AI models will give fleets deeper insights into driver risk and roadway conditions than either company could provide independently.
Read More →
From Silos to Solutions: Relationship Management for Safer Fleets
From telematics adoption and driver accountability to policy consistency and risk mitigation, this episode breaks down what it really takes to build a safer fleet culture without slowing business down.
Read More →
IIHS Launches First Commercial Vehicle Safety Evaluations
The Insurance Institute for Highway Safety has begun evaluating heavy-duty pickups and cargo vans for driver protection. Which models earned top marks?
Read More →
Reducing Risk by Eliminating Phone Use Behind the Wheel
Hosted with the cofounder of Lifesaver Mobile, this episode addresses phone use behind the wheel and how to design a driving environment that actually helps prevents accidents.
Read More →
Cameras, Safety and Insurance: From Reactive Claims to Real-Time Prevention (Part 2 of 2)
Part Two: Commercial auto remains one of the most challenging and costly lines of coverage for fleet operators and insurers alike. Continue learning more about how to effectively address these issues from Onur Aksan, Enterprise Business Development Executive, Geotab
Read More →
How 5-Second Telematics Data Is Changing Fleet Safety
This episode connects with Steve Santostasi of Ford Pro and covers how a few seconds of data can make a difference in fleet safety.
Read More →