




5 U.S. Cities Rank Among World’s Most Traffic-Congested Areas
For the sixth consecutive year, Los Angeles topped the list of the world’s most gridlocked cities, with drivers spending 102 hours in congestion in 2017 during peak time periods, according to the annual INRIX Global Traffic Scorecard.
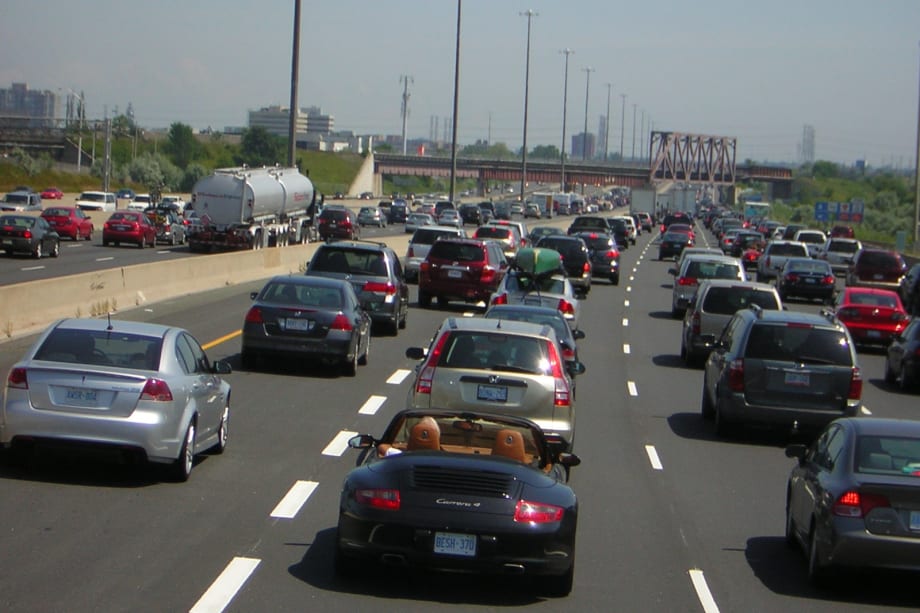
Photo via Haljackey/Wikimedia.
Photo via Haljackey/Wikimedia.
For the sixth consecutive year, Los Angeles topped the list of the world’s most gridlocked cities, with drivers spending 102 hours in congestion in 2017 during peak time periods, according to the annual INRIX Global Traffic Scorecard.
The U.S. accounted for five of the Top 10 cities worldwide with the worst traffic congestion. In addition to Los Angeles, New York City tied with Moscow for second place with 91 hours in congestion, San Francisco (79 hours) ranked fifth, Atlanta (70 hours) ranked eighth, and Miami (64 hours) ranked tenth.
INRIX analyzed 1,360 cities across 38 countries. Based on the findings, the U.S. ranked as the most congested developed country in the world, with drivers spending an average of 41 hours a year in traffic during peak hours. The report concludes that congestion costs drivers nearly $305 billion in 2017, an average of $1,445 per driver.
While the economic impact is one issue, gridlock can also have a major impact on road safety. Experts have long known that frayed nerves from sitting in hours of congestion can lead to aggressive behavior.
A study published in 2016 by the AAA Foundation for Traffic Safety found that 78% of U.S. drivers reported having engaged in at least one aggressive driving behavior during the past year. The most common behaviors included: Intentionally tailgating another vehicle (50.8%); yelling at another driver (46.6%); and honking the horn “to show annoyance or anger” (44.5%). The study suggests that underlying issues in the driving environment, such as congestion, can contribute to aggressive driving.
However, the new data from INRIX implies that traffic congestion across the country is unlikely to clear up anytime soon. Additional noteworthy facts from the report include:
New York’s Cross Bronx Expressway topped the list as the U.S.’s worst corridor for the third year in a row, with the average driver wasting 118 hours per year
Commuters within Boston and San Francisco had the highest U.S. congestion rates on arterial and city streets during the peak commute hours (23 percent)
The worst downtown slowdowns were in El Paso, Texas, where speeds dropped from 43 mph at free flow speeds to 5 mph when congested
New York businesses suffered the most from congestion with an average of 14 percent of travel time on weekdays in gridlock and where drivers wasted the most daytime hours stuck in traffic in the entire U.S.
Santa Cruz, Calif., had the worst overall daytime congestion on arterial and highways, with drivers spending 12 percent of their days sitting in traffic.
Read the full report here.
More Safety

From Driver Well-Being to EV Charging | AF News Recap
Mental health belongs in the fleet safety conversation. This week, we’re looking at five ways fleets can support employee well-being before a crisis, plus Holman’s expansion in Mexico, new one-day Fleet Forward passes, and why EV charging demand is outpacing infrastructure growth.
Read More →
Nexar-Nauto Merger Aims to Give Fleets Better Safety Intelligence Through Larger Driving Dataset
Stefan Heck tells Automotive Fleet that combining more than 10 billion miles of driving history with Nexar's AI models will give fleets deeper insights into driver risk and roadway conditions than either company could provide independently.
Read More →
Don't Wait for a Crisis: 5 Ways to Build Mental Health Into Your Fleet Safety Program
For Suicide Prevention Month, fleet and safety leaders have an opportunity to put mental health where it belongs: at the center of workplace safety.
Read More →
How Camera Data Can Strengthen a Fleet’s Insurance Renewal
Insights from a commercial insurance carrier and a broker show how fleets can turn video telematic data, driver coaching, and improved claims results into a stronger case at insurance renewal.
Read More →
The Safest Fleets Aren’t the Ones with the Most Technology
You’ve made the telematics investment. Here’s how to capture the other half of its value and build the safest fleet on the road.
Read More →
Hidden in Plain Sight: Fleet Compliance Risks
Fleet compliance isn't just about having policies — it's about consistently enforcing them. This practical guide reveals six hidden compliance risks common in public sector and shared fleet operations and outlines proven strategies to improve visibility, accountability, and audit readiness
Read More →
NETS Sets 2026 Fleet Safety Benchmark Conference for Indianapolis
The Sept. 15–17 program will feature fleet benchmarking data, case studies, emerging technologies, and implementation strategies while running alongside the NSC Safety Congress & Expo.
Read More →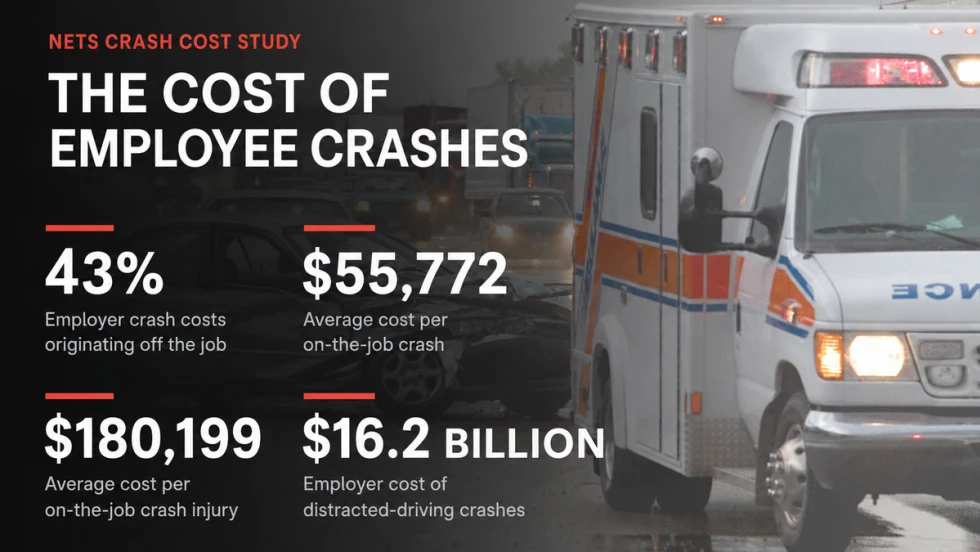
Off-the-Job Crashes Account for 43% of Employers’ $61.7 Billion Crash Burden
NETS quantifies costs dispersed across fleet, risk, HR, and other departments while providing new per-crash benchmarks for employers.
Read More →
Ram Recalls More Than 1.27 Million 1500 Pickups for Seat Belt Anchor Issue
The recall affects certain 2019-2026 Ram 1500 pickups that may have improperly attached second-row seat belt buckle anchors.
Read More →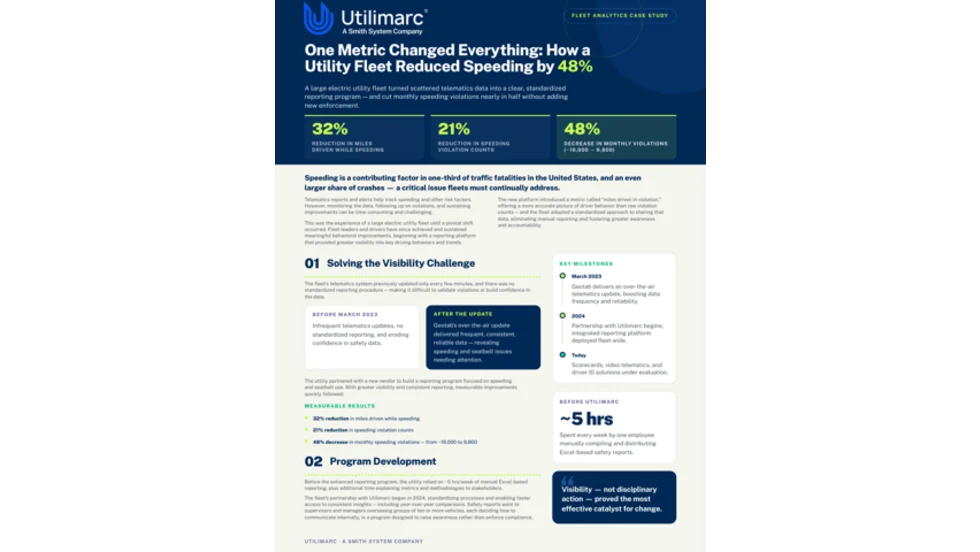
How Better Visibility Cut Speeding Violations by 48%
Fleet leaders don't need more data, they need clearer visibility into what the data is saying. This case study explores how one utility replaced speeding-event counts with a single metric — miles driven in violation — to strengthen safety and significantly reduce speeding violations.
Read More →