


More News: Auction Sales Show Healthy Growth In July
Wholesale Vehicle Prices Decrease In July
Wholesale appreciation trends have continued to be a bit more volatile this year as tariffs have stirred demand in used markets for customers worried about price increases.
August 13, 2025
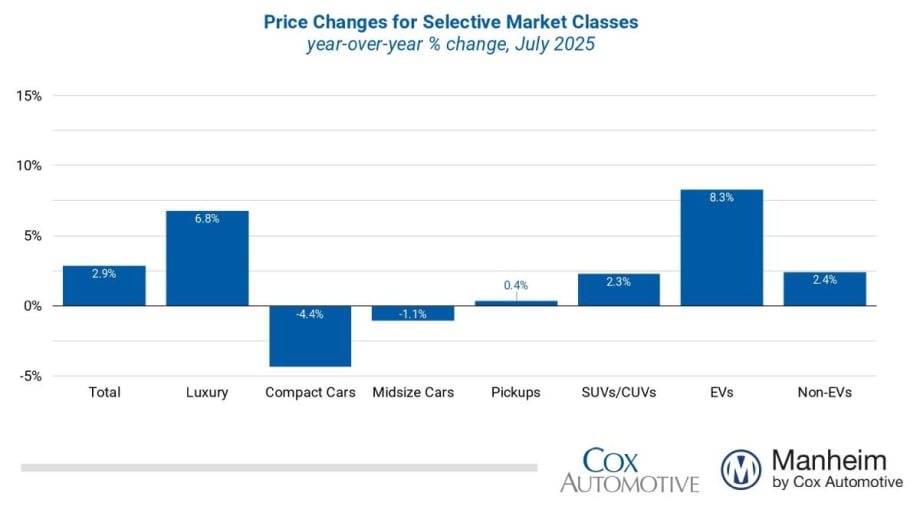
Most major market segments were higher for seasonally adjusted prices year over year in July, except the car segments.
Graphic: Cox Automotive
6 min to read
Wholesale used-vehicle prices (on a mix, mileage, and seasonally adjusted basis) were lower in July compared to June, according to the Manheim Used Vehicle Value Index (MUVVI).
The index declined to 207.4, which is still an increase of 2.9% from a year ago but lower than June levels by 0.5%. The seasonal adjustment muted the results for the month, as non-seasonally adjusted values overall fell more than usual. The non-adjusted price in July decreased 1.4% compared to June, which now makes the unadjusted average price higher by 3.0% year over year.
“Wholesale appreciation trends have continued to be a bit more volatile this year as tariffs have stirred demand in used markets for customers worried about price increases,” said Jeremy Robb, senior director of economic and industry insights at Cox Automotive, in a news release. “The Manheim index has spent the last five months bouncing higher or lower against the previous read, as price changes are felt more acutely with lower inventory levels. We are starting to see some of the new MY 2026 vehicles, and as that mix grows, we will get a better hint of the increases car makers are trying to pass along to consumers. But both new and used retail sales have remained relatively healthy. When you couple that with tighter inventory levels at Manheim, we generally have pretty solid demand at the auction.”
In July, Manheim Market Report (MMR) values saw mixed price changes, with the largest weekly decline occurring in the middle of the month, while prices showed some appreciation in later weeks. In the final week of July, values rose by 0.1% and were flat in the week before, showing lower depreciation rates than we normally see.
Over the last four weeks, the Three-Year-Old Index decreased an aggregate of 0.3%, less than usual. Those same weeks delivered an average decrease of 0.6% between 2014 and 2019, indicating depreciation trends were more muted for the month overall and likely influenced by the relatively tight inventory levels observed.
Over the month, daily MMR Retention, which is the average difference in price relative to the current MMR, averaged 99.2%, meaning market prices stayed below MMR values this month and they were flat to June levels. Against last year, valuation models were down by 0.6 percentage points (60 bps) for MMR retention although they are higher than July levels seen in 2022 and 2023. The average daily sales conversion rate rose to 56.9%, an increase of 0.1% against last month and higher than usually seen at this time of year. For comparison, the daily sales conversion rate averaged 51.6% in July in the previous three years.
July Wholesale Prices By Vehicle Market Segment
Most major market segments were higher for seasonally adjusted prices year over year in July, except the car segments. Compared to July 2024, the luxury segment rose the most for the sixth month in a row, increasing by 6.8%, with SUVs also higher by 2.3% over the last year, though below the industry average.
Also lower than the industry, trucks were higher by just 0.4%, mid-size sedans declined 1.1%, and compact cars fell the most, down 4.4% against last year. Almost every segment was lower compared to the previous month, except for trucks which were higher by 0.2%.
Mid-size sedans were lower by just 0.1%, and the luxury segment declined by 0.3%. The SUV segment was down 0.8% against June, and compact cars fell by a full point, a loss of 1.0% in the period.
EVs Showing Larger Gains Than The Market
Looking at the market by powertrain, electric vehicle (EVs) values are still showing larger gains against last year than the market overall, which is partially driven by depressed values observed in the comparison period. For reference, wholesale EV values showed strong declines in the second half of 2023 and first half of 2024, making the current year-over-year valuation changes more notable. EV values have shown higher year-over-year appreciation trends for the last four months consecutively and were higher by 8.3% against the same month in 2024, while non-EVs rose by 2.4%. For July, EV values declined more than non-EVs, falling by 0.7% against the prior month, while non-EVs increased by 0.1% over the same period.
Retail Used-vehicle Sales Were Up in July
Assessing retail vehicle sales based on observed changes in units tracked by vAuto, initial estimates of retail used-vehicle sales in July were up 1.7% compared to June and up 2% year over year. The average retail listing price for a used vehicle decreased 0.2% over the last four weeks.
Using estimates of retail used days’ supply based on vAuto data, an initial assessment indicates July ended at 46 days’ supply, down one day from 47 days at the end of June and down two days from July 2024 at 48 days.
New vehicle sales in July increased by 6.6% from last year, and volume also picked up steam in June, rising 9.3% from an elevated level and continuing to show some volatility from the tariff announcement. The July sales pace, or seasonally adjusted annual rate (SAAR), came in at 16.4 million, up 0.6 million from last year’s pace and much higher than the 15.3 million in June.
Combined sales into large rental, commercial, and government fleets rose 17.9% year over year in July, as rental rose sharply and commercial fleet sales were higher, and those increases were able to offset continued weakness in the government segment. Including an estimate for fleet deliveries into dealer and manufacturer channels, the remaining new retail sales were estimated to be up 6.7% from last year, leading to an estimated retail SAAR of 13.8 million, up from 12.9 million in June and higher than the 13.4 million last July. Fleet share was estimated to be 15.0%, just down from last year’s 15.1% share.
Rental Risk Price and Mileage Results Remained Mixed Against Last July
The average price for rental risk units sold at auction in July increased 4.3% year over year. Additionally, rental risk prices fell by 1.4% compared to June, in line with the move for the wholesale market overall. Average mileage for rental risk units in July (at 48,200 miles) fell 11.9% for the month against last year’s level but was a little higher against the June comparison, rising by 0.6% over the month.
Measures of Consumer Confidence Improved Slightly in July
The Conference Board Consumer Confidence Index increased 2.1% in July, erasing some of the decline from June, and was stronger than expected. Consumers’ views of the present declined slightly while views of the future improved strongly. Consumer confidence was down 4.6% year over year. Plans to purchase a vehicle in the next six months declined to the lowest level in three months and was slightly lower year over year.
The sentiment index from the University of Michigan increased 1.6% in July to 61.7 and added to a stronger gain in June but was slightly weaker than the reading at the beginning of the month. The index was down 7.1% year over year. The underlying views of current conditions improved, but future expectations declined slightly. Expectations for inflation in one year decreased to 4.5% from 5%, and expectations for inflation in five years decreased to 3.4% from 4%. Consumers’ views of buying conditions for vehicles improved, as views of prices and interest rates both improved slightly.
The daily consumer sentiment index from Morning Consult increased 1.3% in July, reversing some of June’s decrease and leaving the index up 6.2% year over year.
According to AAA, the national average price for unleaded gas decreased 3 cents in July from the end of June to $3.15 per gallon, down 10% year over year but up 2.9% year to date.
More Remarketing
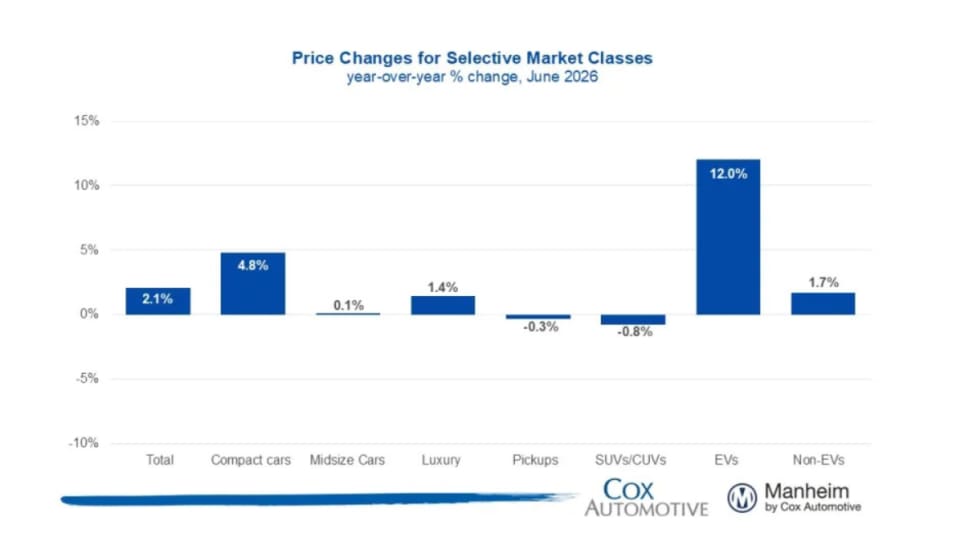
Manheim Index Shows Used-Vehicle Wholesale Prices Up 2.1% in June
The market is seeing stronger appreciation in older used vehicles this year, and the most affordable segments have been among the year’s best performers.
Read More →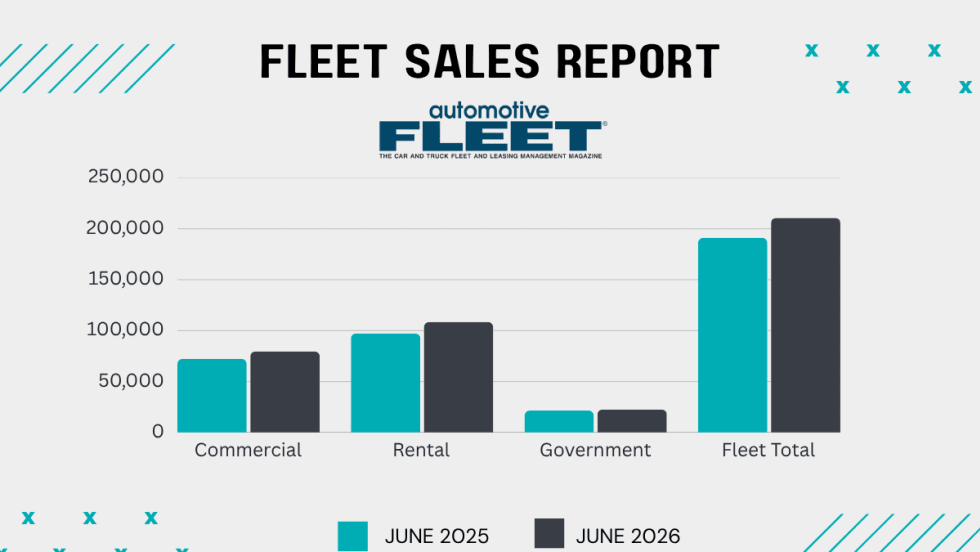
Commercial Fleet Sales Contribute To June, YTD Gains
The fleet sector has boosted its vehicle purchases at a reliable pace in the first half of this year compared with 1H 2025.
Read More →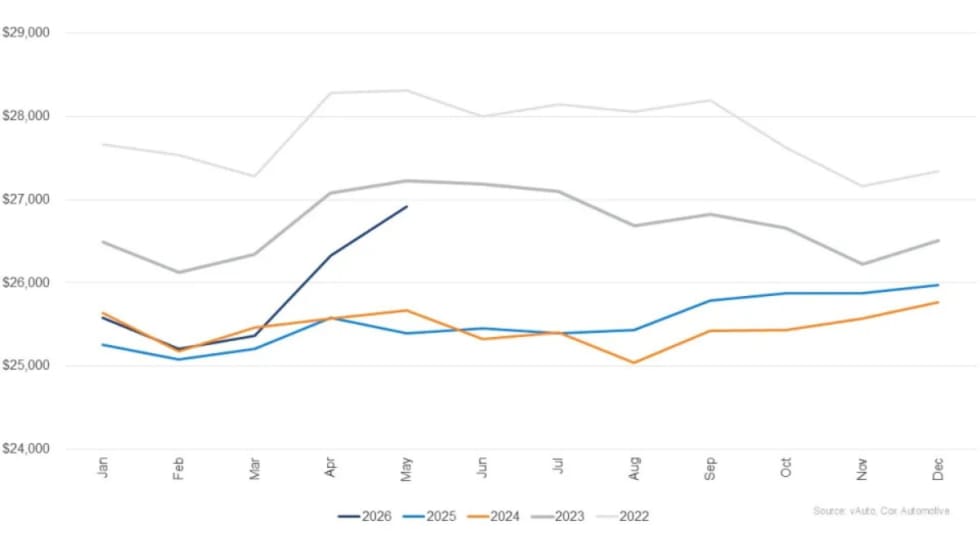
Used Vehicle Prices Climb Higher As Sales Pace Slows
The higher prices at used retail reflect strong wholesale values earlier in the spring, particularly for older, more affordable vehicles.
Read More →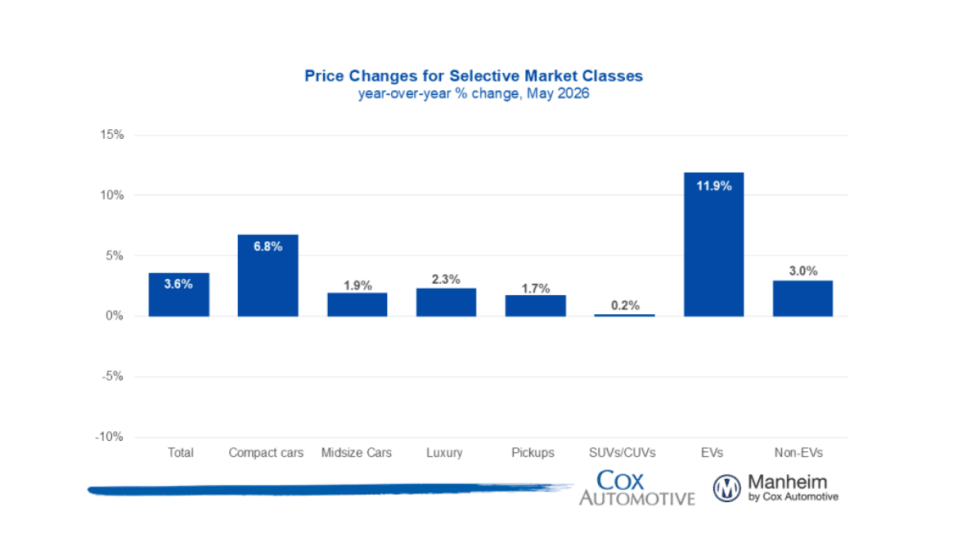
Wholesale Used Vehicle Market Sustains Moderate Rise In Values, Prices
Trends continue to normalize after a strong start to the year, as consumers contend with higher gas prices in the coming summer months.
Read More →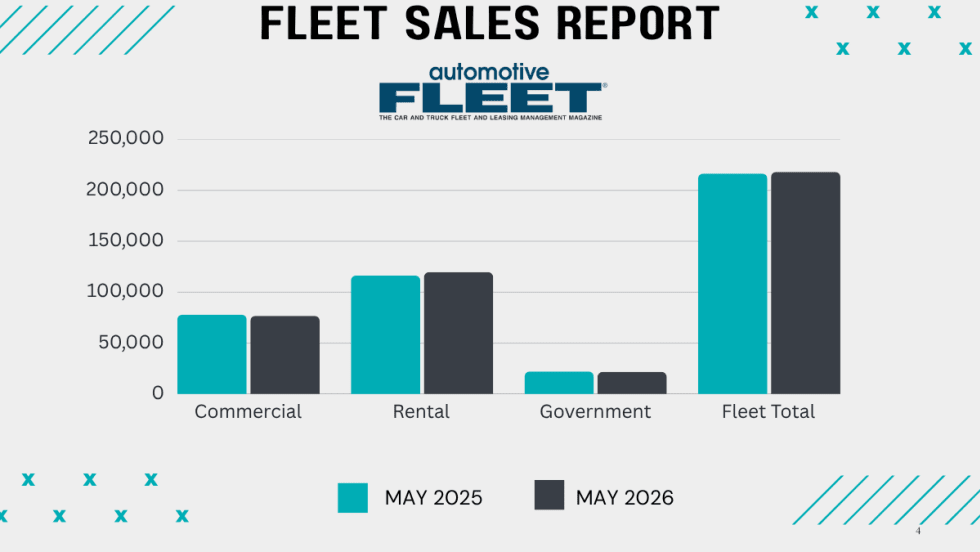
Commercial Fleet Sales Still Lead Sectors Despite May Mini Dip
The U.S. economy's continued growth and positive business investment are creating a favorable environment for fleet vehicle demand.
Read More →
How Connected Vehicle Data Is Lifting Fleet Resale Values
A vehicle health score could improve the value of fleet vehicles at remarketing. The path to a universal standard is forming, and fleets that understand the process early will be better positioned when it arrives.
Read More →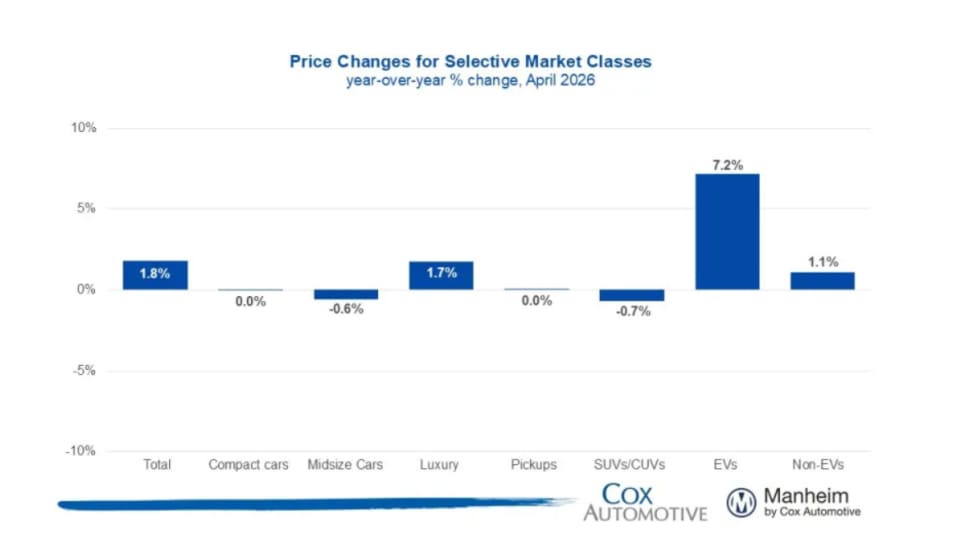
Wholesale Used Vehicle Prices Slightly Up In April
The Iranian conflict and rising gas prices inject much uncertainty into the future wholesale used vehicle markets, as higher gas prices soak up spendable income from vehicle buyers.
Read More →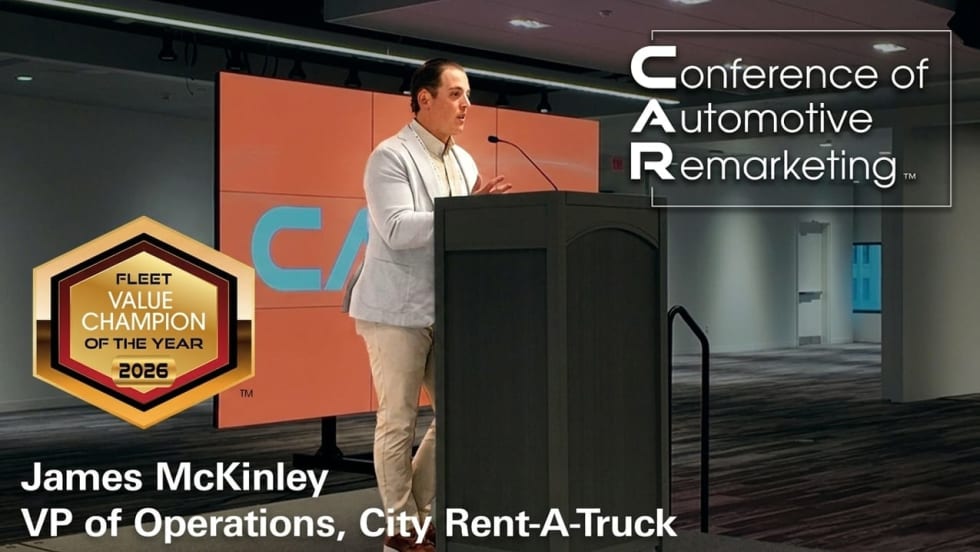
CAR2026: James McKinley Wins Value Champion of the Year
James McKinley of City Rent a Truck was named the inaugural Fleet Value Champion at the CAR Conference for his data-driven approach to fleet lifecycle management and vehicle remarketing.
Read More →
CAR2026: Eric Autenrieth Wins Remarketer of the Year
Eric Autenrieth was recognized at this year's CAR Conference as the Remarketer of the Year.
Read More →
CAR2026: Lawrence Knapp Wins Consignor of the Year
Lawrence Knapp won the Cosigner of the Year award at this year's CAR Conference.
Read More →